
Using Open Source for API Observability

API Observability isn’t exactly new, however it’s popularity has seen rapid growth in the past few years in terms of popularity. API Observability using open source is different from regular API monitoring, as it allows you to get deeper and extract more valuable insights. Although it takes a bit more effort to set up, once you’ve got an observability infrastructure running it can be immensely helpful not only in catching errors and making debugging easier, but also in finding areas that can be optimized.
Imagine you’re running a webshop, and one day the process of adding something to the cart becomes very slow. With traditional monitoring you would need to have set up specific metrics around the cart service, and hopefully those metrics will be able to help you. Unfortunately, it’s unlikely that you would set up metrics for each http request your service is making because it would cause an explosion of metrics. Instead, you would probably opt to collect aggregated metrics both because of the hassle but also the cost of keeping all those metrics around. With observability, you would have detailed metrics on every single request that the service has made, and be able to make correlations to CPU and RAM usage at the time of the request. This allows you to see exactly what is happening with the cart service so you know why it’s taking a long time to add something.
In this article, you’ll see how you can set up API observability in Kubernetes using the open-source tools Istio and Kiali. In addition, I’ll show you how to dive even deeper using a commercial tool called Speedscale.
Why Do You Need API Observability?
Before answering the question of why you need API observability, it’s important to understand what it is. Traditionally, infrastructure engineers use API monitoring, which is the predecessor to API observability. With API monitoring, you define different metrics to keep track of important Key Performance Indicators (KPIs) that give you understanding of how your application is performing. These indicators can be something like requests per second, which allows you to get an insight into how much load your application is handling. You can also look at error rates to understand if you need to fix something. In general, you can set up many different singular indicators to try and get a holistic understanding of your API. For more information check out the golden signals outlined in the Google SRE handbook.
API Observability takes monitoring and puts it into overdrive. Instead of just viewing singular individual metrics, you get a complete cohesive overview of your infrastructure. Especially with the introduction of distributed tracing where you can see the entire journey of a request from the client to the database and back. With full tracing you get much greater insight into how everything is performing end-to-end. With API Observability, you’re not only viewing the metrics you’ve set up for monitoring for, you’re getting a complete look into how your components are interacting. Instead of trying to guess what might be useful, you have a wide range of automated instrumentation to draw from. Perhaps the easiest way to understand this big picture view is with Service Maps.
In this day and age, where many organizations are running hundreds or thousands of microservices, you need observability in order to properly monitor your application and infrastructure. You can get deeper insights than what is possible with traditional API monitoring.
Implementing API Observability with Istio and Kiali
It’s assumed that you already have some prior knowledge with Istio on how it uses CRDs and sidecars before starting this tutorial. So as not to make any assumptions on the system you’re working on, let’s start out by downloading Istio:
$ curl -L https://istio.io/downloadIstio | sh -Now move your terminal into the download directory. As of writing, the above command is downloading v1.13.4, so I’ll execute the command cd istio-1.13.4. Now you also need to make sure that istioctl is added to your path:
$ export PATH=$PATH:$PWD/binNow you can finally install Istio into your cluster by running:
$ istioctl install --set profile=demo -yYou’ll notice that the demo profile is chosen here, but in production you’d likely use the default profile. Now that Istio is installed you can start using it to instrument your applications. For the purpose of this tutorial, you’ll be deploying the microservices demo from Google. But, before deploying the demo you need to configure your Namespace to work with Istio. This is done by first creating the Namespace for the demo, and then adding a label to the Namespace:
$ kubectl create namespace microservices-istio &&
  kubectl label namespace microservices-istio istio-injection=enabled &&
  kubectl config set-context --current --namespace=microservices-istio
Now let’s download the microservices demo and deploy it to the Namespace:
$ git clone https://github.com/GoogleCloudPlatform/microservices-demo.git &&
  cd microservices-demo &&
  kubectl apply -f release/kubernetes-manifests.yaml
After a few minutes the microservices should be deployed, which you can monitor by running kubectl get pods.
At this point, your application is instrumented with the Envoy sidecar proxy, and it’s time to add the Kiali dashboard so you can view the Service Map. To do so, make sure you’re still in the Istio directory you downloaded earlier, then run kubectl apply -f samples/addons. This will add the following services:
- Grafana
- Grafana is a data visualization dashboard
- Jaeger
- Jaeger is a tool that helps implement distributed tracing
- Zipkin
- An alternative to Jaeger
- Kiali
- The dashboard where you can get an overview of your infrastructure
- Prometheus
- Metric collection tool
You can check the progress of the Kiali deployment by running kubectl rollout status deployment/kiali -n istio-system. Once you get the message ‘deployment "kiali" successfully rolled out’, you need to run istioctl dashboard kiali. This will create a tunnel to your Kiali dashboard and allow you to view your infrastructure.

At this point you’ve successfully set up API observability using Istio and Kiali. If you are interested in how to extend this visibility using a commercial solution, take a look at the next section.
API Observability with Speedscale
Speedscale is a tool that provides very deep API observability in Kubernetes environments. Unlike typical API observability tools, Speedscale deconstructs request and response payloads to see the exact details of each call. To get started with it, create an account at https://app.speedscale.com. Then you can install the Speedscale CLI either using Brew (brew install speedscale/tap/speedctl) or using the install script (sh -c "$(curl -sL https://downloads.speedscale.com/speedctl/install)"). You will be asked for an API key during the install, which you can find in the Speedscale UI. Verify that everything is working as intended by running seedctl check. If no errors are reported, you’re ready to instrument your applications.
You can instrument your applications with Speedscale in two ways. You can either manually add the needed annotations, or you can use the speedctl install comand. The speedctl install command is arguably the easiest, as it guides you through the instrumentation. As opposed to how Istio does it, with Speedscale you should deploy your applications before you instrument them. So, start by deploying the microservices demo:
$ kubectl create namespace microservices-speedscale &&
  kubectl config set-context --current --namespace=microservices-speedscale &&
  git clone https://github.com/GoogleCloudPlatform/microservices-demo.git &&
  cd microservices-demo &&
  kubectl apply -f release/kubernetes-manifests.yaml<button>COPY</button>
Now you’re ready to instrument the applications by running the speedctl install command. Doing so will give you an output resembling the following:
$ speedctl install
 _ _
 ___ _ __ ___ ___ __| |___ ___ __ _| | ___
/ __| '_ / _ / _ / _<code> / __|/ __/ _ | |/ _
__ |_) | __/ __/ (_| __ (_| (_| | | __/
|___/ .__/ ___|___|__,_|___/_____,_|_|___|
 |_|
This wizard will walk through adding your service to Speedscale. When we're done, requests going into and out of your service will be sent to Speedscale.
Let's get started!
Choose one:
 [1] Kubernetes
 [2] Docker
 [3] Traditional server / VM
 [4] Other / I don't know
 [q] Quit
▸ What kind of infrastructure is your service running on? [q]: 1
✔ Checking Kubernetes cluster access...OK
✔ Checking for existing installation of Speedscale Operator...OK
Choose one:
 [1] default
 [2] istio-system
 [3] kube-node-lease
 [4] kube-public
 [5] kube-system
 [6] microservices-istio
 [7] microservices-speedscale
 [8] speedscale
 [q] Quit
▸ Which namespace is your service running in? [q]: 7
▸ Add Speedscale to all deployments in the microservices-speedscale namespace? Choose no to select a specific deployment. [Y/n]:
ℹ With your permission, Speedscale is able to unwrap inbound TLS requests. To do this we need to know which Kubernetes secret and key holds your TLS certificate. Certificates are not stored in Speedscale Cloud nor are they exported from your cluster at any time.
▸ Would you like to unwrap inbound TLS? [y/N]:
 The following labels will be added to the microservices-speedscale namespace:
 "speedscale": "true"
 The following annotations will be added to deployments:
 sidecar.speedscale.com/inject: "true"
 sidecar.speedscale.com/capture-mode: "proxy"
 sidecar.speedscale.com/tls-out: "true"
▸ Continue? [Y/n]:
✔ Patching namespace...OK
✔ Patching deployments...OK
 ℹ Patched microservices-speedscale/adservice
 ℹ Patched microservices-speedscale/cartservice
 ℹ Patched microservices-speedscale/checkoutservice
 ℹ Patched microservices-speedscale/currencyservice
 ℹ Patched microservices-speedscale/emailservice
 ℹ Patched microservices-speedscale/frontend
 ℹ Patched microservices-speedscale/loadgenerator
 ℹ Patched microservices-speedscale/paymentservice
 ℹ Patched microservices-speedscale/productcatalogservice
 ℹ Patched microservices-speedscale/recommendationservice
 ℹ Patched microservices-speedscale/redis-cart
 ℹ Patched microservices-speedscale/shippingservice
▸ Would you like to add Speedscale to another deployment? [y/N]:
Thank you for using Speedscale!
Looking for additional help? Join the Slack community!
https://slack.speedscale.com/</code>
Now your application is instrumented with Speedscale, and you can log onto https://app.speedscale.com to view your service connectivity.

The Speedscale Service Map provides some of the same visibility as Kiali. However, in addition to a simple service map Speedscale allows you to inspect the details of each individual transaction:
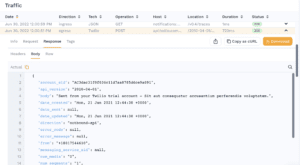
Unlike open source solutions, Speedscale can provide deep inspection of the headers, query parameters and response bodies of each request. Kiali and Speedscale both provide excellent visibility but Speedscale takes things a step further with no code modifications.
Open-Source vs Commercial Solution
When you’re thinking about implementing an open-source tool, you’ll always hear the discussion about whether you should use an open-source tool, or if you should instead buy a managed solution. It’s a great discussion to have, as the answer isn’t always clear-cut. In fact, there’s never a single answer, you need to consider the pros and cons of each solution.
An open-source solution has the obvious advantage of being free, which will attract many organizations, especially small companies like startups. Using open-source will let you get functionality like API Observability without any upfront cost. However, the upfront cost is only one part of the equation. You always need to consider the Total Cost of Ownership (TCO) and capabilities of the solution. TCO encompasses everything that goes into setting something up, like engineering hours. It may very well be that you are spending so many engineering hours setting up and configuring something, that the most cost-effective solution is to buy a managed solution.
Besides that, there are some reasons for choosing a commercial managed solution, like getting official support channels, which you don’t always get with open-source. Many open-source projects rely on the community for support. Whether open-source or commercial is the right solution for you and your company is up to you, but remember to include all cost factors in your calculations.
Conclusion
By now, you’ve seen how quickly you can implement API Observability using open-source tools like Istio and Kiali. You’ve also seen an example of using Speedscale, a commercial solution that provides similar but also complementary functionality. Which one of these options is the right for you will depend on the needs of your organization. Open-source has no upfront license cost but will require engineering hours to install, maintain and use. The commercial solution will be more streamlined, result in less maintenance and setup, and provide deeper visibility but does require upfront cost.