Systems | Development | Analytics | API | Testing

Observability

How to Automate Service Mesh Observability With Kuma

The more services you have running across different clouds and Kubernetes clusters, the harder it is to ensure that you have a central place to collect service mesh observability metrics. That’s one of the reasons we created Kuma, an open source control plane for service mesh. In this tutorial, I’ll show you how to set up and leverage the Traffic Metrics and Traffic Trace policies that Kuma provides out of the box. If you haven’t already, install Kuma and connect a service.

How to get Observability for Apache Airflow

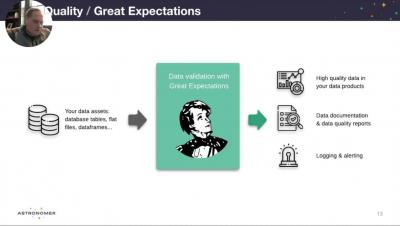
Observability of Apache Airflow presented by Ry Walker, Founder & CTO at Astronomer. Apache Airflow has become an important tool in the modern data stack. We will explore the current state of observability of Airflow, common pitfalls if you haven't planned for observability, and chart a course for where we can take it going forward.

Going Beyond Observability for Spark Applications & Databricks Environments

Join Chris Santiago, Solutions Engineer Director at Unravel Data, as he takes you through Unravel’s approach to getting better and finer grain visibility with Spark applications and how to tune and optimize them for resource efficiency. An overview of out of the box tools like Ganglia and their overall lack of visibility on Databricks jobs How Unravel helps you gain finer grain visibility, observability, monitoring into Spark data pipelines How Unravel can recommend better configurations and tuning of Spark applications.

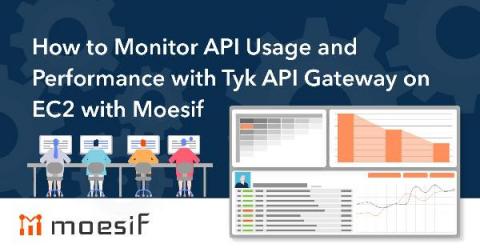
How to Monitor API Usage and Performance with Tyk API Gateway on EC2 with Moesif

This article provides an introduction to API Observability and how it fits within the overall APIOps Cycles. Then, we will walk through an example of how to successfully deploy and leverage Tyk Gateway and Moesif API Observability on Amazon EC2.

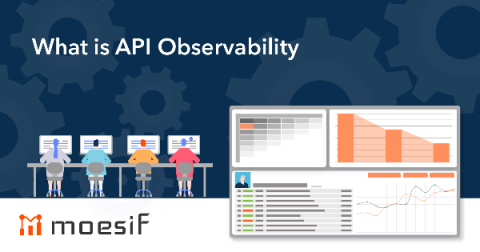
What is API Observability

API Observability is a key component to properly execute APIOps Cycles and ensure your building something of value for your API users. If you’re not familiar with APIOps Cycles, take a look at this guide which provides an agile framework to quickly build APIs that are business-oriented and serve customer needs. API Observability itself is an evolution of traditional monitoring and born out of control systems theory.

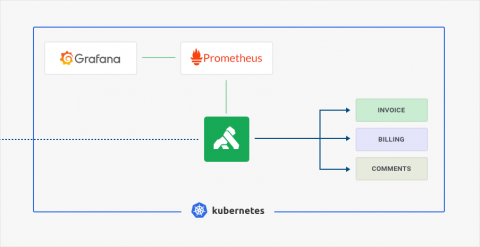
Observability For Your Microservices Using Kong, Kubernetes, and Prometheus

In this video, Kevin Chen, Developer Advocate at Kong, will explain how to set up Prometheus monitoring with Kong Gateway to get black box metrics and observability for all of your services deployed on Kubernetes. This guide can also be applied to other solutions like StatsD, Datadog, Graphite, InfluxDB etc.

3 cool tech tapas we found at Cisco Live Europe

I love traveling to Barcelona for conferences. Between Gaudi’s architecture and tech architectures, there’s really not much more I can ask for. Walking into Cisco Live!, the first thing I encountered was the huge indoor fountain called the “Rain Wall”, which was built to raise awareness and celebrate Cisco’s Corporate Social Responsibility program.

Observability For Your Microservices Using Kong and Kubernetes

In the modern SaaS world, observability is key to running software reliability, managing risks and deriving business value out of the code that you’re shipping. To measure how your service is performing, you record Service Level Indicators (SLIs) or metrics, and alert whenever performance, correctness or availability is affected.