Systems | Development | Analytics | API | Testing
%term
How to Migrate an Existing Application to Serverless | AWS
What Is a Data Pipeline?
A data pipeline is a series of actions that combine data from multiple sources for analysis or visualization. In today’s business landscape, making smarter decisions faster is a critical competitive advantage. Companies desire their employees to make data-driven decisions, but harnessing timely insights from your company’s data can seem like a headache-inducing challenge.
What are ETL tools?
Thinking of building out an ETL process or refining your current one? Read more to learn about how ETL tools give you time to focus on building data models. ETL stands for extract-transform-load, and is commonly used when referring to the process of data integration. Extract refers to pulling data from a particular data source. Transforms are used to make that data into a processable format. Load is the final step to drop the data into the designated target.
Which is the Execution Order of Elements in Apache JMeter?
The execution order of the elements in an Apache JMeter performance test plan is very important, it helps understand the timeline of events and how your test will behave. Make sure that you understand every JMeter element before adding it to your test plan, this will help create faster performance tests and not jump into various errors.
Checklist For Mobile App Testing
Every mobile application, irrespective of its category, has a common goal of creating an impeccable user experience. App users want to see something new and innovative. And even though the great user experience is the most important, it only comes with quality. To ensure quality, mobile app testing is essential. In this blog, we will discuss a step-by-step mobile app testing checklist.
Introduction to Event Loop Utilization in Node.js
In the last year, I've spent many hours writing patches for libuv and Node to collect new metrics. The goal of this was to indirectly infer the state of the application without introducing measurable overhead. I've run a few hundred hours of benchmarks and collected over one million data points to make sure my analysis was correct. Eventually, I plan to write about all aspects of my research, but today we will focus on a metric that has already been added to Node.
Enhanced Audit Log Launched
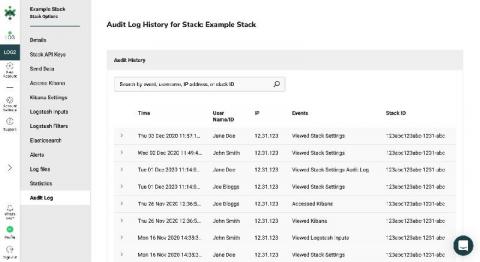
We’re pleased to announce that we’ve recently launched our improved audit log feature and have rolled this out to users across all of Logit.io’s operating regions. The audit log is visible on both account and individual Stack level.
Best website load testing services
Website load testing services determine how websites deal with online traffic. Too often, people equate it with performance testing. However, load testing is just a type of website performance testing. Other types of performance testing include endurance testing, volume testing, scalability testing, spike testing, and stress testing. In website deployment, it is common that transactions may fail and systems crash. It is due to concurrent demands on the website and adjustment over resources.
Achieve Pin-Point Historical Analysis of Your Salesforce Data
Want to look at how data has changed over time? Simply enable history mode, a Fivetran feature that data analysts can turn on for specific tables to analyze historical data. The feature achieves Type 2 Slowly Changing Dimensions (Type 2 SCD), meaning a new timestamped row is added for every change made to a column. We launched history mode for Salesforce in May and have been delighted with the response.


