

|
By Ken Ahrens
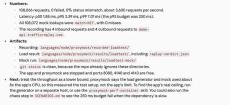
Before you can answer whether checkout will survive Black Friday, you need a test you can rerun. In this demo, we used a coding agent and the Speedscale skills to record a Node app, mock its downstream API, and run a 30-second load test with 10 virtual users. That’s a small first step in holiday readiness. It gives you a working test and a result to inspect, with time left to fix what you find before a code freeze.
|
By Matt LeRay
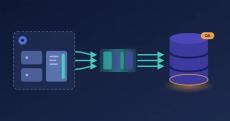
The first PostgreSQL post ran on a laptop: a demo app, a Docker container, and the proxymock CLI. That is the fastest way to see the idea. It is also not where your database problems live. Your real query mix lives in the cluster, where a Java service with a connection pool, an ORM and a schema migration tool sends the statements nobody wrote by hand. This post deploys an open source banking app to Kubernetes and records the queries one of its services sends to PostgreSQL.
|
By Shaun Duncan
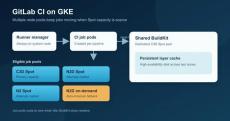
Here at Speedscale, our monorepo has 19 Go projects in CI. Fifteen produce container images for both amd64 and arm64; a few of those need CGO. We also publish cross-compiled CLI binaries for macOS, Linux, and Windows.

|
By Matt LeRay
Before you start, paste this into Claude Code, Cursor, Codex, Gemini CLI, Kiro, or any assistant that can read a URL and run commands: The install-speedscale skill installs proxymock for your operating system and walks you through proxymock init. It stops when you need to complete browser sign-in, keeps your recordings on your machine, and connects the proxymock MCP server so your assistant can run the prompts later in this article.
|
By Matt LeRay
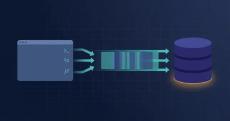
The first number from my local PostgreSQL 16 test was roughly 1,600 statements per second. It looked impressive. It was also the least useful result in the run. The useful part was the workload. It came from queries the demo app had actually sent: the same prepared statements, parameters, reads and writes. A synthetic benchmark tells you how PostgreSQL handles a synthetic workload. It does not tell you whether your migration just broke the UPDATE your app depends on.

|
By Alan Mon
Remember when “going shopping” meant getting in the car? This fall, filling the tank feels like applying for a small loan. U.S. regular gasoline averaged about $4.48 a gallon for the week of September 21, 2026. A round trip to the store starts competing with free shipping. And free shipping never needs a parking spot. That doesn’t tell us how many shoppers will move online this holiday season.

Sponsored Post
|
By Alan Mon
Ask an AI for K-pop concert advice without saying the group, city, date, or budget. It may confidently send you to a BLACKPINK tribute night in Cleveland with a $400 resale ticket. The AI was plenty confident. It just had nothing real to go on. That is exactly what happens when developers test AI applications with invented traffic. The test may look reasonable. The result may even pass. But when real users arrive, with messy histories, incomplete inputs, odd request sequences, and unpredictable timing, the application has to improvise. And improvising is expensive.

|
By Matt LeRay
A shared Kubernetes cluster rarely belongs to one team. Payments runs checkout in one namespace, search runs search-api in another, and a risk team runs a scorer somewhere else. One Speedscale forwarder captures API traffic for all of them. Redacting that traffic before it leaves the cluster is what makes it safe to use for testing (the background is in The PII Testing Dilemma). Until now, that forwarder ran exactly one DLP rule. Every team that needed a field redacted had to edit the same JSON document.
|
By Ken Ahrens
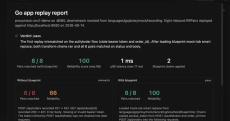
When I ask an AI agent to change code, I also want it to run the application and test what it changed. Asking it to write some tests is a start. But if it invents the expected responses from the same assumptions it used to write the code, those tests can miss the same mistake. Traffic replay gives the agent something concrete to test against: requests and responses captured from a working application.

|
By Shaun Duncan
In Under the Hood with Go TLS and eBPF, I left socket tracking as an exercise for later. The example used bpf_get_current_pid_tgid() and explicitly excluded concurrent TLS operations. Capturing plaintext was enough for that post. With rustls, later arrived: I could read the HTTP payload perfectly and still attach it to the wrong TCP connection. That’s a frustratingly convincing failure. The request looks right. The response looks right. The application works.


|
By Speedscale
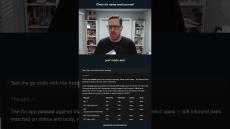
With gas prices driving shoppers online, load test your site with Speedscale to ensure high holiday traffic and slow speeds don't crash your checkout page on Black Friday.
|
By Speedscale
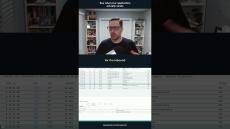
Learn how to easily set up and run automated tests for your Go code using recorded replays, then try running your own test replay today! Read more: speedscale.com.
|
By Speedscale
Inspect your inbound and outbound API calls in detail to give your AI agent the exact traffic context it needs; use the link to get started! Learn more: speedscale.com.

|
By Speedscale
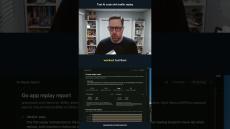
Stop making your AI coding agent guess how your app works with massive prompts. We feed live API traffic and runtime evidence directly into your agent so it can automatically detect bugs, run replays, and fix code fast! Learn more: speedscale.com.


|
By Speedscale
A breakdown of the three potential ways software engineers will interact with AI coding assistants, ranging from local desktop setups to fully automated software delivery factories. Learn more: speedscale.com.

Claude and Codex Are Slowing Your Engineering Team Down #speedscale #devops #aicoding #claude #codex
|
By Speedscale
While AI coding tools dramatically slash development time, they are quietly inflating testing and maintenance burdens because teams no longer fully understand their codebase. Discover how leading engineering teams are shifting focus to testing and context packages to eliminate bottlenecks and unlock true AI efficiency.
|
By Speedscale
AI agents can write tests, but those tests can repeat the same assumptions that led to the code. In this walkthrough, I use Cursor and proxymock to replay real application traffic against a local Go app, compare requests and responses, and validate code changes with real data.

- October 2026 (9)
- September 2026 (18)
- August 2026 (22)
- July 2026 (24)
- June 2026 (27)
- May 2026 (17)
- April 2026 (27)
- March 2026 (22)
- February 2026 (18)
- January 2026 (31)
- December 2025 (13)
- November 2025 (14)
- October 2025 (13)
- September 2025 (17)
- August 2025 (14)
- July 2025 (8)
- June 2025 (1)
- May 2025 (4)
- April 2025 (16)
- March 2025 (8)
- February 2025 (2)
- January 2025 (7)
- December 2024 (16)
- November 2024 (9)
- October 2024 (25)
- September 2024 (12)
- August 2024 (9)
- July 2024 (4)
- June 2024 (4)
- May 2024 (3)
- April 2024 (5)
- March 2024 (3)
- February 2024 (3)
- January 2024 (1)
- December 2023 (6)
- November 2023 (2)
- October 2023 (5)
- September 2023 (3)
- August 2023 (12)
- July 2023 (3)
- June 2023 (3)
- May 2023 (3)
- April 2023 (3)
- March 2023 (7)
- February 2023 (6)
- January 2023 (4)
- December 2022 (2)
- November 2022 (4)
- October 2022 (2)
- September 2022 (3)
- August 2022 (5)
- July 2022 (5)
- June 2022 (2)
- May 2022 (4)
- April 2022 (4)
- March 2022 (4)
- February 2022 (15)
- January 2022 (6)
- December 2021 (3)
- November 2021 (4)
- October 2021 (5)
- September 2021 (5)
- August 2021 (6)
- July 2021 (5)
- June 2021 (6)
- May 2021 (5)
- April 2021 (2)
- March 2021 (5)
- February 2021 (2)
- January 2021 (2)
- November 2020 (1)
Continuous Resiliency from Speedscale gives you the power of a virtual SRE-bot working inside your automated software release pipeline. Forecast the real-world conditions of every build, and know you’ll hit your SLO’s before you go to production.
Feed Speedscale traffic (or let us listen) and we’ll turn it into traffic snapshots and corresponding mock containers. Insert your own service container in between for a robust sanity check every time you commit. Understand latency, throughput, headroom, and errors -- before you release! The best part? You didn’t have to write any scripts or talk to anyone!
Automated Traffic Replay for Every Stakeholder:
- DevOps / SRE Pros: Understand if your app will break or burn up your error budget before you release.
- Engineering Leads: Let Speedscale use traffic to autogenerate tests and mocks. Introduce Chaos testing and fuzzing.
- Application Executives: Understand regression/performance, increase uptime and velocity with automation.
Before you go to production, run the projection.