Systems | Development | Analytics | API | Testing

Debugging

Hot Sauce Releases: Boost Mobile App Reliability with Network Throttling and Advanced Debugging

Presenters: Ashwini Sathe - Sr. Group Product Marketing Manager Parth Patel - Solution Engineer About the Webinar: Ensuring that your mobile app delivers a flawless performance across all devices is critical for success. In this webinar, we introduce the latest enhancement in the Sauce Labs Real Device Cloud: Network Throttling for iOS and Android. This feature is a game-changer in our centralized debugging experience, empowering developers to deliver a delightful user experience even under varying network conditions.

Debugging in Ruby with Debug

Debugging is a valuable skill for any software engineer to have. Unfortunately, most software engineers are not trained in it. And that's not just specific to developers going through boot camps; even in universities, we are not often taught and trained to use a debugger. My teachers and mentors were more interested in getting me to write programs rather than debugging them. If we are fortunate, debugging comes at the end of the semester, in a short, last session.

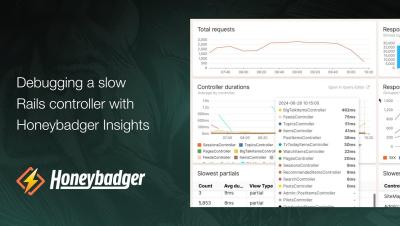
Debugging a slow Rails controller with Honeybadger Insights

Join Honeybadger cofounder Ben Curtis as he uses Honeybadger Insights to debug a slow controller action in Rails. Honeybadger Insights is a new full-stack logging, observability, and performance monitoring tool from Honeybadger.io. Gain insights into your errors, application logs, and other event streams with a powerful query language and ready-made dashboards.

Testing and Debugging in Django: Advanced Techniques and Tools

Django is one of the leading Python frameworks used to create full-stack web applications. In this comprehensive guide, you will explore the intricacies of testing and debugging within the Django framework, focusing on advanced methodologies and essential tools. Beginning with the fundamentals of Django unit and integration testing, you will delve into advanced techniques such as mocking, testing middleware, and profiling for optimal performance.

Debugging in Ruby with pry-byebug

For a software engineer, even the basic use of a debugger can save a lot of pain: adding breakpoints (places in the code the program will stop at and expose the current context) is very easy, and navigating from one breakpoint to another isn't difficult either. And with just that, you can say goodbye to a program's many puts and runs. Just add one or more breakpoints and run your program.

Debugging and Diagnosing the Kong Gateway With Ease

We’re excited to announce the general availability of Kong Gateway 3.5 for Open Source (OSS). This release enables Javascript developers to extend the Gateway via the WebAssembly layer which is currently in Beta, delivers some enormous observability enhancements, and unlocks top-end performance. Keep reading for the latest on Kong Gateway 3.5 for OSS!

Troubleshooting PHP Segmentation Faults: Effective Debugging Tips

PHP, one of the world's most popular server-side scripting languages, powers a significant portion of the internet's dynamic web applications. While PHP is renowned for its flexibility and ease of use, it is not immune to the challenges that come with complex software development. One such challenge is the occurrence of segmentation faults, elusive errors that can leave developers scratching their heads in frustration.