|
By Benjamin
The year 2024 was special for us in several respects. It’s been a decade since the unveiling of Tideways’ predecessor, and we’ve come a long way since then. We would like to express gratitude to our customers, partners, colleagues, friends, and family for their ongoing support and dedication. Without you, we wouldn’t be where we are today. We are particularly pleased to be able to welcome many new partners this year.
|
By Benjamin
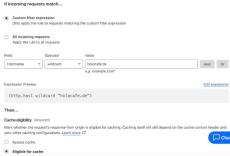
We recently helped our customer Holocafé prepare its Laravel application for a TV appearance on the German edition of Dragons’ Den (Höhle der Löwen) and the corresponding peak in traffic. The primary change was to utilize Cloudflare as an HTTP reverse proxy to cache the main page of the site and a few other mostly static pages that users were most likely to click on. The expectation was that 80-90% of the curious users could be served with pages from the HTTP cache.
|
By Benjamin
The close of 2024 is near, and that also means a new version of PHP is about to be released: 8.4! There has already been some discussion regarding the latest features and modifications affecting developers, for example on either stitcher.io or php.watch. We wrote this post with a totally different angle, highlighting the performance, debugging, and operations-related changes in PHP 8.4 that are usually less publicized. Several of these changes were even contributed by Tideways.
|
By Benjamin
In applications that use closures excessively, understanding stack traces as part of the debugging experience has historically been complicated by the fact that the names of closures did not include the source location. In a PHP stack trace, whenever a frame was represented by a closure, it only contained the reference {closure} and the namespace the closure was declared in, leading to all closures within a namespace looking identical.
|
By Benjamin
Every so often, a careful profiling analysis of your application detects the bottleneck in third-party code and there is little remedy for you to override or change that code. In this blog post I want to present a solution to fixing performance problems in third-party libraries by using the composer patches plugin. I use the the Symfony ErrorHandler as an example.
|
By Diana
We strive to improve clarity and user-friendliness, and have thus focused our efforts on several features that align with this objective. Our new Sidebar Menu, the Release Tracking Feature and an increased comparison range for Releases and Markers as well as the possibility to show error messages in notifications all fall into this category. Summary.
|
By Benjamin
Tideways is joining the Open Source Pledge because we want to make a public commitment on our various open source contributions. Not only do we rely on open source software in our product Tideways, we are also building our business on top of the open source language PHP and its continued success. The mission of the recently started Open Source Pledge initiative is to establish a new social norm in the tech industry of companies paying Open Source maintainers.
|
By Volker
One of our recurring jobs at Tideways is to ensure that all of our instrumentation works with the new and upcoming PHP versions. For us, “working” doesn’t just mean that the results are correct, but that your PHP extension is fast, gathering insights for our customers with a minimal performance overhead.
|
By Benjamin
The upcoming PHP 8.4 release will include the brand-new feature “property hooks”, a mechanism to add logic to a class property when read from or written to. One benefit of this feature is that you do not need to protect property access with a private property and public getter/setter methods anymore. You can find out how this feature works in the RFC and other places, but in the spirit of this blog we want to focus solely on the performance implications.
|
By Benjamin
Sometimes, performance is the primary requirement when you are picking a third-party library to solve a task in your application. For CPU intensive work, there are often similar alternatives that you can choose from: To find out which one of them is more performant for your use-case, you can set up an experiment with microtime/hr_time calls and run them against each other. But: this provides fewer insights than running your tests directly with a Profiler such as XHProf or Tideways!
|
By Tideways
Making an application scale is generally seen as something that only the most magical of developers can do, but it is easy once you have the correct tools. Fortunately for us, these tools are freely available online! In this talk, we will look at a few available options to learn what our applications are actually doing, help identify bottlenecks, and fix them so we can move on to the most important part of any project: delivering features.
|
By Tideways
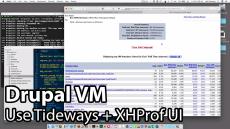
How to use Tideways with XHProf UI to profile PHP code in Drupal VM.
- December 2024 (1)
- November 2024 (4)
- October 2024 (2)
- September 2024 (2)
- August 2024 (2)
- June 2024 (2)
- April 2024 (1)
- March 2024 (2)
- February 2024 (1)
- December 2023 (1)
- November 2023 (1)
- August 2023 (1)
- April 2023 (1)
- January 2023 (1)
- December 2022 (1)
- November 2022 (1)
- October 2022 (1)
- September 2022 (1)
- June 2022 (1)
- May 2022 (2)
- March 2022 (1)
- February 2022 (1)
- November 2021 (1)
- September 2021 (1)
- August 2021 (1)
- July 2021 (1)
- May 2021 (1)
- February 2021 (1)
- November 2020 (1)
- August 2020 (1)
- May 2020 (1)
- March 2020 (2)
- February 2020 (3)
- January 2020 (2)
- December 2019 (1)
- November 2019 (1)
- October 2019 (3)
- June 2019 (1)
- May 2019 (1)
- January 2019 (1)
- August 2018 (4)
- June 2018 (3)
- December 2017 (1)
- October 2017 (1)
- August 2017 (2)
- April 2017 (1)
- February 2017 (1)
Tideways saves you time by taking the guesswork out of your app's backend performance. Gain detailed insights, spot performance bottlenecks, and get real-time error detection alerts.
Experience your application from the customer’s point of view. Your team can find broken code, see where slow load times occur, and get notified when an error is detected or a page crashes - all from within one tool.
Spend more time shipping and less time stuck on bottlenecks:
- Monitoring + Alerting: See where there’s room to improve your app’s user experience through detailed performance insights. Spot changes in trends over time and get alerted whenever something’s not right.
- Profiling: Gain full visibility into your code to uncover any slowdowns via traces - collected every minute - or trigger traces yourself for any request that you need more information on.
- Error + Exception Tracking: Identify and create fixes for issues caused by new or previously unseen fatal errors and uncaught exceptions.
Your mission control center for PHP application performance.


