Systems | Development | Analytics | API | Testing

Profiling

The difficulty of Memory Profiling in PHP

Did you ever have a memory leak in your PHP program and couldn't locate the exact source in your code? From my experience with memory profiling in PHP, this is caused by the PHP engine and how it manages memory. PHP uses a custom memory manager on top of the native memory management in C for multiple reasons...

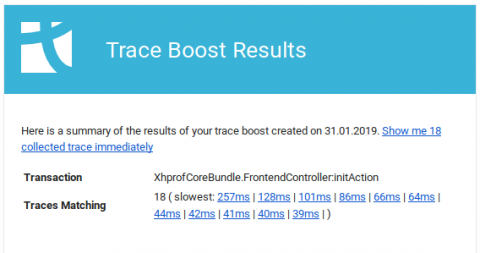
Testing a new approach to Memory Profiling in PHP with XHProf

Memory profiling in PHP has traditionally been hard. Most memory profilers compare the memory or peak memory before and after a function call to find out how much memory usage increased or decreased. This can be achieved by calling the equivalent of memory_get_usage() and memory_get_peak_usage() functions from within the profiling extension.

How does the PHP Realpath Cache work and how to configure it?

The realpath cache in PHP is often overlooked and its exact workings are a bit of a mystery to many developers, fueled by a lot of explanations on the web that are just plain wrong. How exactly is the realpath cache working and at which level of PHP? There has been some buzz around realpath cache in the last weeks, so it is a hot topic to look into.

Environments are back: Monitor and Trace Staging, QA and Dev Servers

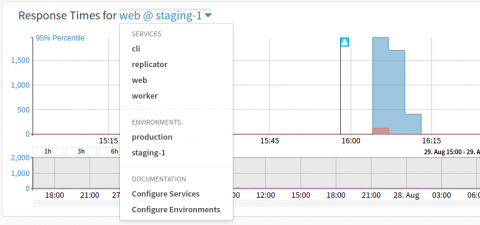
We think monitoring and tracing should be performed across the whole application lifecycle and that it should be easy to compare changes between production, staging/QA and production environments. But for technical reasons we had to remove explicit support for multi-environment monitoring and tracing almost 2 years ago, when our backend and worker jobs couldn't handle the data from our original prototype data model.

Improved Dashboard with Preview Chart and Recent Performance Metrics

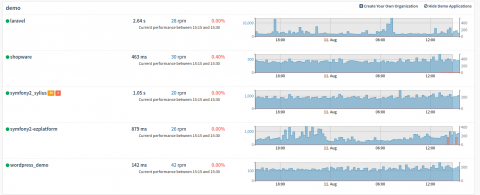
We have improved the dashboard in Tideways to include preview charts with the last 24 hours of performance data and the performance of the most recent 15 minute interval. This provides you with a much better overview of all your applications and by selecting any time range in the preview chart you can directly jump to a time-range that interests you.