Systems | Development | Analytics | API | Testing

Development

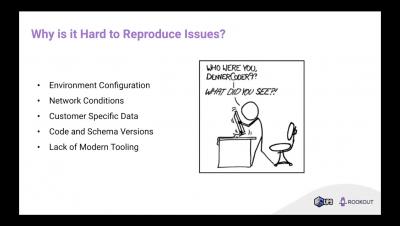
Solving Customer Related Problems with R&D

As an R&D manager, there are many things on my mind that keep me up at night. These thoughts range anywhere from impossible research explorations, employee motivation, rising cloud costs, all the way to security incidents. However, there is one that sweeps all of them aside when they surface and that is solving customer facing issues.

Lighthouse Performance Metrics: What They Are & How to Improve Them

Google has made page speed a ranking factor in mobile searches for quite sometime now. Thus measuring performance has become a key part of any web development project. Performance, accessibility and general SEO best practices are major factors in search engine rankings. Your site's performance can have a big impact on how it is perceived. It can be stated as how fast a website is, or how good the user experience is with the site.

Node.js Server Monitoring: A How to Guide

Node.js is one of the most popular Javascript frameworks in 2021. With the increasing demand for Node.js comes the crucial next step of Node.js server monitoring. The best way to monitor your Node.js server is with an Application Performance Monitoring (APM) tool. Keep in mind, Node.js server monitoring is a bit of a tricky task, and there are particular challenges you should be aware of. But don’t worry because this how-to guide will walk you through it step-by-step.

Debugging in PHP

PHP is a great language to start with when you are learning how to code. It has a simple syntax, it’s easy to learn and you can make dynamic websites with it. But even though it’s easy to write PHP code, it’s not always easy to debug. There are a lot of tools out there that can help you, but since PHP is an interpreted language, you can also use a couple of debugging techniques to help you find bugs in your code. In this blog post I'll cover the the following sections.

Updates from Bugfender Q1, 2021

Welcome to the spring Bugfender newsletter! We’ve been working on the past months improving some of our SDKs, making it easier to integrate Bugfender thanks to API improvements and introducing some new features to make your debugging experience even better. Furthermore, we’ve been actively writing fresh content for our blog. Make sure you don’t miss out on our featured articles for this quarter below!

How to Detect Memory Leaks in Java: Causes, Types, & Tools

A memory leak is a situation where unused objects occupy unnecessary space in memory. Unused objects are typically removed by the Java Garbage Collector (GC) but in cases where objects are still being referenced, they are not eligible to be removed. As a result, these unused objects are unnecessarily maintained in memory. Memory leaks block access to resources and cause an application to consume more memory over time, leading to degrading system performance.

Lessons Learned When Building A Kubernetes Operator

As we see more customers adopting Rookout for debugging cloud-native applications, we are not surprised to learn that a significant number of them work in a microservice environment. In the most common case among these customers, each service has its own code repository maintained by the team who develops the service.