Anodot

Redwood City, CA, USA
2014
  |  By David Drai
Databricks is a popular platform for running Apache Spark workloads in the cloud. While Databricks makes it easy to spin up Spark clusters on demand, this flexibility can also lead to higher costs if not managed properly. In this article, we’ll explore some techniques for optimizing your Databricks clusters to reduce costs without sacrificing performance.
  |  By David Drai
Effective management of Redshift costs is closely tied to data storage optimization. Choosing the right data types and implementing data compression are pivotal in reducing storage footprints and costs. Redshift’s columnar storage format enhances query performance, which in turn can lead to significant savings. For a more comprehensive approach, integrating tools like Anodot can provide advanced analytics and real-time visibility to further streamline storage efficiency and optimize costs.
  |  By Anodot
It’s hard to believe enterprise BI platforms have been around for three decades. In that time, they have served the purpose of collecting and analyzing large amounts of data to help businesses make more informed decisions. But in today’s data-driven economy, analysts struggle to keep up with the myriad of business intelligence reports from traditional BI tools – which fail to effectively and efficiently analyze and interpret data in real-time.
  |  By Anodot
“Data-driven” is the latest buzzword in organizations in which data-based decision making is directly connected to business success. According to Gartner’s Hype Cycle, more than 77% of the C-suite now say data science is critical to their organization meeting strategic objectives. For top organizations looking to adopt a data-driven culture to stay competitive, what does that mean?
  |  By Anodot
Everyone from managers to C-suite executives wants information from analytics in order to make better decisions. Business analytics gives leaders the tools to transform a wealth of customer, operational, and product data into valuable insights that lead to agile decision-making and financial success. Traditional business intelligence and KPI dashboards have been popular solutions but they have their limitations.
  |  By Anodot
Marketing teams routinely struggle with monitoring the performance and cost of their ad campaigns. Now, they have a solution that can be as easy as just a few clicks. We recently joined our partners at Rivery for a webinar demonstrating the new Anodot Markering Analytics Monitoring Kit. The kit allows users to track marketing campaigns in real-time and take the action needed to make the most of ad spend.
  |  By Anodot
Business analytics (BA) is the process of evaluating data in order to gauge business performance and to extract insights that may facilitate strategic planning. It aims to identify the factors that directly impact business performance, such as ie. revenue, user engagement, and technical availability. BA takes data from all business levels, from product and marketing, to operations and finance.
  |  By Anodot
We’re excited to announce that we’ve teamed up with Rivery to offer our data pipeline and monitoring solutions in one. Our one-click Data Kits streamline the analytics process, saving teams valuable time so they can act on business incidents fast. To kick things off, we’re releasing the Anodot Marketing Analytics Monitoring Kit. Now you can start tracking your marketing campaigns instantly, and make the moves that will make the most of your ad spend.
  |  By Ira Cohen
Success in today’s high-velocity business environments means having the correct information to make the right decisions at the right time. As marketplaces grow more competitive and customer expectations continually rise, the “right time” is often real-time. Every transaction generates a plethora of data. Anomalies within your company’s data set can represent opportunities and threats to the business.
  |  By Anodot
For modern businesses faced with increasing volumes and complexity of data, it’s no longer efficient or feasible to rely on analyzing data in BI dashboards. Traditional dashboards are great at providing business leaders with insights into what’s happened in the past, but what if they need actionable information in real time? What if they want to use their data to estimate what may happen in the future? Companies are taking notice.
  |  By Anodot
Create event streams with Anodot’s latest data collection capability.
  |  By Anodot
Stream your segment events as metrics combined with other data sources into Anodot’s centralized analytics platform. Learn how to sync Anodot to your segment data in a few simple steps.
  |  By Anodot
Anodot presents demo of AI-powered business monitoring platform at Finovate, a global conference showcasing cutting edge banking and financial technology.
  |  By Anodot
Chief Data Scientist Ira Cohen has spent years tackling the ins and outs of forecasting business data. Now he's sharing how he and his team at Anodot are using machine learning to generate more accurate forecasts for time series data.
  |  By Anodot
Welcome to our first ever customer event- Anodot Connect! During the power hour, we discuss best practices, talk about new features, the product roadmap and everything in between. Tune in to hear how you, our power users, can better make use of the Anodot product.
  |  By Anodot
When you detect that something is off in your business, how long does it take you to find the root cause? The longer it takes, the more it can cost you. Correlation analysis identifies relationships between KPIs, which business teams use to accelerate root cause analysis (RCA) and mean time to remediation (MTTR). Doing it manually however can be tedious and limit your visibility.
  |  By Anodot
Anodot collects AWS real-time usage metrics and AWS CUR files to enable full visibility. Anodot automatically learns each service usage pattern, using patented anomaly detection technology and alert relevant teams to anomalous spikes or drops in real-time. Our patented anomaly detection technology learns the behavior and every service you use - EC2, S3, ELB and the rest, to automatically identify any deviation from the expected usage and cost pattens. Leave alert storms, false positives, and dashboards behind and leverage the power of proactive, autonomous monitoring.
  |  By Anodot
Now there’s an easy way to measure the business impact of every incident. Anodot lets you set a monetary value for each measure you monitor. Once you set the Impact Value, future alerts will show you how much the anomaly has cost you thus far. Anodot is the only monitoring solution built from the ground up to find and fix key business incidents, as they’re happening. As opposed to most monitoring solutions, which focus on machine and system data to track performance, Anodot also monitors the more volatile and less predictable business metrics that directly impact your company’s bottom line.
  |  By Anodot
Time series anomaly detection is a tool that detects unusual behavior, whether it's hurtful or advantageous for the business. In either case, quick outlier detection and outlier analysis can enable you to adjust your course quickly, before you lose customers, revenue, or an opportunity. The first step is knowing what types of outliers you’re up against. Chief Data Scientist Ira Cohen, co-founder of Autonomous Business Monitoring platform Anodot, covers the three main categories of outliers and how you'll see them arise in a business context.
  |  By Anodot
Business metrics are notoriously hard to monitor because of their unique context and volatile nature. Anodot’s Business Monitoring platform uses machine learning to constantly analyze and correlate every business parameter, providing real-time alerts and forecasts in their context. This is machine learning packaged in a turn-key solution – no data science experience needed.
  |  By Anodot
This introduction to next-generation analytics includes a step-by-step comparison between legacy BI and Autonomous Analytics, from data integration to anomaly detection and forecasting.
  |  By Anodot
Learn now anomaly detection can remedy urgent problems faster and capture opportunities sooner.
  |  By Anodot
Learn how different industries are using Machine Learning Powered Analytics.
  |  By Anodot
Learn how leading adtechs like Rubicon Project, Uprise, and NetSeer are leveraging the power of machine learning - discovering outliers in time series data and turning them into valuable business insights.
  |  By Anodot
Immediately address data quality problems and save weeks of dealing with inaccurately reported data.
  |  By Anodot
This white paper presents unique insights into the costs, benefits, and complexities associated with anomaly detection systems, including whether it makes more sense for your company to build or to buy, and which will give the best and fastest return on investment.
  |  By Anodot
An introduction to design principles of creating a machine learning based anomaly detection system.

Anodot applies AI to deliver autonomous analytics in real-time, across all data types, at enterprise scale. Unlike the manual limitations of traditional Business Intelligence, we provide analysts mastery over their business with a self-service AI platform that runs continuously to eliminate blind spots, alert incidents, and investigate root causes.

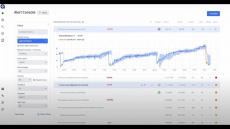
Autonomous Analytics uses machine learning to understand behavioral patterns within time series data, to identify anomalies and to continuously forecast future values. Our alerts operate in real time and offer you context - correlating each incident to similar anomalies, relevant factors and the potential root cause. Detect and diagnose high-impact problems faster than is humanly possible.

Why Autonomous Analytics?

  • Track Every Business Parameter: Anodot uses its patented technology to learn the normal behavior of all your business metrics and constantly monitor their every move. All without configuring a thing.
  • See The Anomalies That Matter: Not all anomalies are created equal. Anodot scores every business abnormality by degree of deviation so you can prioritize and act based on what’s most important to you.
  • Models Automatically Trained For Accuracy: Our solution uses deep learning to automatically optimize forecasts. It selects a model that’s uniquely suited to your metrics from a library of predictive analytics algorithms. Data feedback is used to train your model for the highest possible accuracy.
  • Continuous Forecasting For Operational Agility: Autonomous Forecast is always running. It works on data streams in real time to provide forecasts in the moment. With these capabilities, businesses can anticipate changing conditions and optimize their operations in advance, to improve customer satisfaction and seize opportunities.

The only alerts you need. Just when you need them.