High Scale Postman Load Testing for Kubernetes
In this Postman load testing tutorial, you’ll learn how to run a large scale load test in Kubernetes using your existing Postman collections.
Because HTTP services don’t have a graphical user interface, it’s common to build collections of requests using Postman during the development process. These collections are useful for running quick functionality tests as you develop each endpoint. However, as the service grows you eventually need to test it in a more realistic way with larger volume. This is called a load or stress test. Speedscale is a Production Data Simulation Platform that includes this stress/load testing capability out of the box.
Typically, engineers write Postman collections using Postman’s excellent UI to bootstrap testing of a new service. Speedscale then takes over and creates repeatable validation on demand or as part of the CI/CD process in Kubernetes. This tutorial will teach you to author requests in Postman and turn them into load tests using Speedscale in less than 15 minutes.
What Is Postman API Load Testing
Postman is a tool that aims to test RESTful services (web APIs) by sending HTTP/S requests and analyzing the responses. These services can be built with .NET, PHP, Node.js, or any other language.
With Postman, it’s possible to easily consume local and internet services, and do load and performance tests on the responses to request cookies, status code, response time, and so on.
As the use of web APIs continues to grow, Postman will continue to gain traction as it helps developers analyze the functioning of external services so that you know how to consume them.
Groups of HTTP Requests in Postman are called collections and can be exported as JSON files. Similarly, groups of HTTP Requests in Speedscale are called Snapshots and can be imported from Postman collections or recorded from live services.
Postman Load Testing in Kubernetes
Load testing is used to test how an API behaves under constant load. For the load test to work, you need to run all the tests at once to create a significant load. Additionally, to run a load test in Kubernetes you also need to orchestrate the load generator and its network connection to your service. This can be very complicated but fortunately Speedscale exists to automate the process.
For the rest of this tutorial we will use Speedscale to automate a full load test from a Postman collection. Sign up for a free Speedscale trial here to follow along or use your existing login.
Install minikube on your local machine
To run a load test in Kubernetes, we first need to have a Kubernetes cluster installed. If you already have a test Kubernetes cluster, skip this section.
One of the easiest ways to try out Kubernetes is to run minikube on your local desktop. Navigate to this helpful tutorial and run through the installation. It only takes a few minutes and most of that is time getting a cup of coffee. Note that you only need to finish step 3 “Interact with your cluster.” No need to install their demo application.
Make sure minikube has enough resources to run tests. Although tests can be run with less resources, we use this command on an M1 Apple Mac to have plenty of breathing room:
minikube start --memory=4g --cpus=4 --disk-size=128g --driver=docker --vm=trueSpeedscale collects CPU and memory metrics to understand scalability and cluster performance. This capability requires that metrics-server be installed. To enable in minikube, run the following command
minikube addons enable metrics-serverInstall the Speedscale operator
A Kubernetes operator is a service that manages a certain aspect of your cluster. For this tutorial, the Speedscale operator will orchestrate the running of tests and reporting of results. Full installation instructions can be found in the Speedscale documentation, but the easiest thing to do is install via helm.
Helm is one of the more popular deployment systems for Kubernetes. However, if you don’t already have helm installed on your local desktop, install it using their installation guide. Don’t worry, it’s only a couple of commands and you can get a second cup of coffee.
To install the Speedscale operator, run the following command:
helm install speedscale-operator speedscale/speedscale-operator
 -n speedscale
 --create-namespace
 --set apiKey=<YOUR-SPEEDSCALE-API-KEY>
 --set clusterName=testing-cluster
Replace
Install the Speedscale demo application
To make things easier, we have provided the world’s simplest demo application to load test. If you have your own Postman collection and service to test you can use that instead.
Download and install the Speedscale demo application:
git clone https://github.com/speedscale/demo
cd demo
kubectl apply -k .
This will start the demo application in your minikube cluster in the demo namespace.
Review HTTP requests
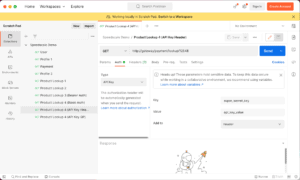
In the demo repository you will see a file labeled speedscale.postman_collection.json. This contains the HTTP requests that we will be using for our load test. If you aren’t interested in the requests you can skip this section but it is usually helpful to understand what’s being called when viewing the load test results.
To take a look around, open Postman on your local desktop and import the collection:
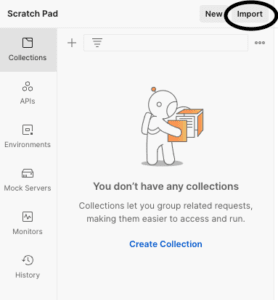
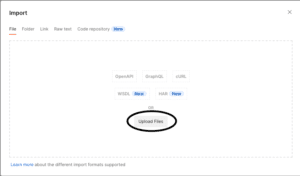
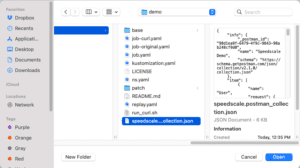
Take a look at the different requests contained in this demo collection. These requests will be run one by one to create a load test of our demo service.
Import Postman collection to Speedscale
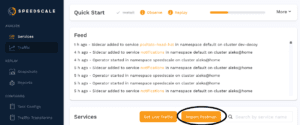
Now that we have a set of requests to use for a load test, let’s import them into our load testing tool. Typically, Speedscale uses real traffic recordings to generate load tests. However, instead of a real world recording we’ll use a Postman collection for this test.
Log into the Speedscale UI and click the Import Postman button.
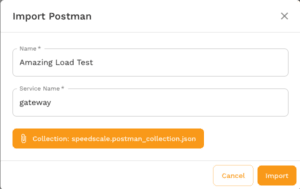
Fill in some default values for the collection name and make sure to upload the postman collection file speedscale.postman_collection.json. Remember, the collection file is the same one we imported into Postman in the previous section. The Service Name should match the service host in your Kubernetes cluster. For this demo app, make sure to fill in gateway as the Service Name. Each HTTP request will have its host replaced with this text, i.e. http://gateway/user.
At this point you should be looking at the Snapshot Summary screen which shows some details about our traffic snapshot.

Find the Replay button in the top right and click it. This will start the process of initiating a load test in your minikube cluster.
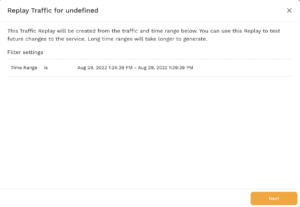
Click Next.
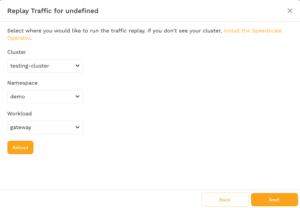
Select your demo cluster, the demo namespace and the gateway workload. In this tutorial we named our cluster testing-cluster during the helm installation. The demo application is automatically installed into the demo namespace. The name of the service this Postman collection was designed for is called gateway.
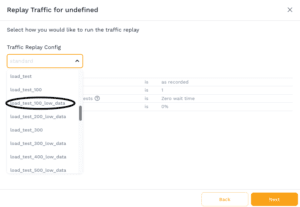
Select load_test_100_low_data from the dropdown. This will cause the load generator to run 100 replicas of our traffic as fast as the application can handle.
Click Next until you reach Start Replay. If you’re interested you can watch the test orchestration in your minikube cluster by viewing the pods:
kubectl -n demo get podsOr if you’re running on Linux/MacOS you can use the watch command to get continuous updates:
brew install watch
watch kubectl -n demo get pods
Over the course of the test you should see at least two pods start and stop:
- speedscale-generator – runs the snapshot (imported Postman collection) as a load test
- speedscale-collector – retrieves environmental metrics like CPU, memory and Kubernetes events
View results
As your report replay runs you’ll be redirected to the report viewer. The Speedscale UI will update as the report progresses. It should start with a pizza tracker-like view to a continuously updating report view like the one below:

Here you can see various metrics about your application’s performance under load. The most interesting metrics to look at first are related to the Google golden signals.
- Latency – the responsiveness of the API under load
- Throughput (aka Traffic) – the number of requests per second running against the API
- CPU/Memory – how many resources are being consumed
- Errors
Conclusion
Postman is a tool that provides you with a graphical interface to easily manipulate your API. You can use it to quickly run requests and speed up development. Speedscale is a complete traffic replay framework for API testing, with native Kubernetes and CI/CD support. Hopefully this tutorial helps you run load tests easily using the strengths of both tools!

