
Load Testing: How Fast Can We Go?

Speedscale creates load tests from recorded traffic so generating load is pretty core to what we do. As a brief overview, we record traffic from your service in one environment and replay it in another, optionally increasing load several fold.
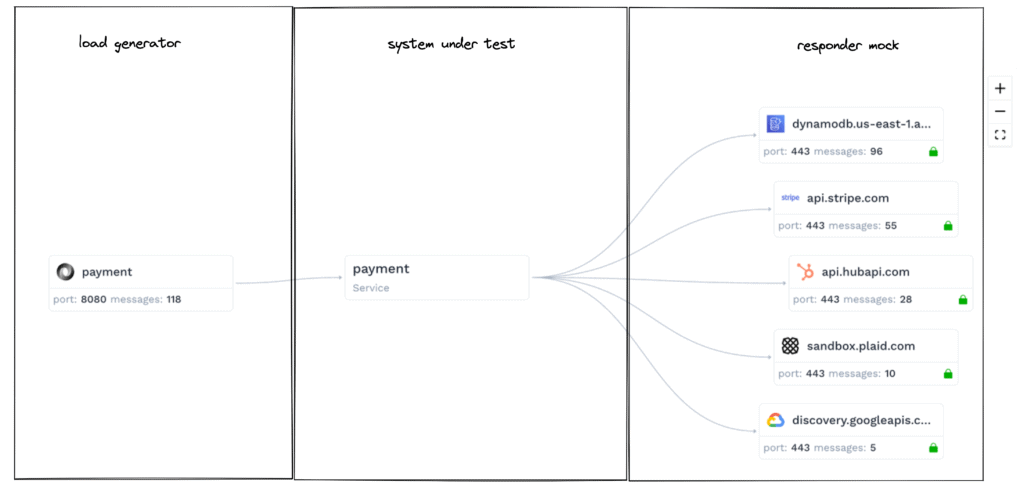
During a replay the Speedscale load generator makes requests against the system under test (SUT), with the responses from external dependencies like APIs or a payment processor optionally mocked out for consistency. Your service is the SUT here.
Currently the load generator runs as a single process, usually inside a pod in Kubernetes. So how fast is this thing, and how did we get to where we are today?
Speedscale Stats
Let’s jump straight into it. The highest throughput we’ve pushed through our load generator is a sustained 65k requests per second against the SUT, with a burst maximum of just over 70k.
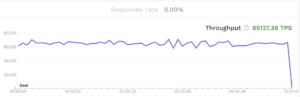
It’s pretty unlikely that a single instance of any SUT could handle more load than this, but let us know if you have one.
For this test, we ran 500 concurrent virtual users (VUs), against Nginx. The hardware was an AWS e2-highcpu-32 with 32 vCPU and 32 GB of memory, but the memory was severely underutilized.
The load generator is highly concurrent and CPU bound, which means on high-throughput replays it will essentially use up all available CPU. The throughput scales linearly with the number of CPUs available.
k6 Stats
But how do we compare to something like k6, an awesome open source load testing tool, on the same hardware?
Let’s run the most basic possible test with the same number of VUs from a pod inside the cluster.
$ cat script.js
import http from "k6/http";
export default function () {
  http.get("http://nginx");
}
$ k6 run --VUs 500 --duration 60s script.js
running (1m00.0s), 000/500 VUs, 9908871 complete and 0 interrupted iterations
default ✓ [======================================] 500 VUs 1m0s
 data_received..................: 1.6 GB 27 MB/s
 data_sent......................: 723 MB 12 MB/s
 http_req_blocked...............: avg=5.26µs min=791ns med=2.08µs max=47.73ms p(90)=3.14µs p(95)=3.88µs
 http_req_connecting............: avg=1.5µs min=0s med=0s max=36.46ms p(90)=0s p(95)=0s
 http_req_duration..............: avg=1.99ms min=64.99µs med=1.24ms max=177.14ms p(90)=4.44ms p(95)=6.02ms
 http_req_receiving.............: avg=30.56µs min=6.53µs med=17.93µs max=64.92ms p(90)=31.43µs p(95)=37.02µs
 http_req_sending...............: avg=57.02µs min=5.75µs med=12.94µs max=50.37ms p(90)=26.17µs p(95)=34.43µs
 http_req_waiting...............: avg=1.9ms min=36.9µs med=1.19ms max=177.11ms p(90)=4.33ms p(95)=5.82ms
 http_reqs......................: 9908871 165132.605767/s
 iteration_duration.............: avg=2.46ms min=99.73µs med=1.58ms max=177.83ms p(90)=5.34ms p(95)=7.37ms
 iterations.....................: 9908871 165132.605767/s
 vus............................: 500 min=500 max=500
 vus_max........................: 500 min=500 max=500
Wow that’s fast. 165k requests per second.
But there’s a problem with this initial test that gives k6 an advantage. First, this is the most basic request possible with no headers, no body, no query parameters, etc. Ideally a load test would replicate load under production conditions to test the parts of the system that will fail first under real load. Also, by default k6 reuses connections across all requests. While this results in very fast throughput that’s not how real clients connect to your service. The Speedscale load generator uses a different connection for each VU to ensure more realistic network load.
Let’s try again with the --no-vu-connection-reuse flag and traffic from speedctl export k6 which produces a k6 script from recorded traffic.
$ cat script.js
import http from "k6/http";
export default function () {
  {
    let params = {headers: { 'Tracestate':'', 'User-Agent':'Go-http-client/1.1', 'Accept-Encoding':'gzip', 'Baggage':'username=client', 'Traceparent':'00-1820a9bd3cdad9c00dc5339667e3d888-6a990ee8122cdab7-01' },};
    let body = '{"user": "a5d4e", "message": "be there soon"}';
    http.request('POST', 'http://nginx/chat', body, params);
  }{
    let params = {headers: { 'Accept-Encoding':'gzip', 'Baggage':'username=client', 'Traceparent':'00-b511b6049e2625ea61431025a68b2817-f7f2ddce0ee63039-01', 'Tracestate':'', 'User-Agent':'Go-http-client/1.1' },};
    let body = '{"message": "notification received"}';
    http.request('POST', 'http://gateway/sms', body, params);
  }{
    let params = {headers: { 'Baggage':'username=client', 'Traceparent':'00-9195b4d5a9f8bbc73066598e8766d0df-a1187148bbb921f5-01', 'Tracestate':'', 'User-Agent':'Go-http-client/1.1', 'Accept-Encoding':'gzip' },};
    let body = '';
    http.request('GET', 'http://gateway/v0.4/traces', body, params);
  }{
    ...
  }
$ k6 run --vus 500 --duration 60s --no-vu-connection-reuse script.js
running (1m07.6s), 000/500 VUs, 1999 complete and 0 interrupted iterations
default ✓ [======================================] 500 VUs 1m0s
 data_received..................: 343 MB 5.1 MB/s
 data_sent......................: 476 MB 7.0 MB/s
 http_req_blocked...............: avg=50.09µs min=1.41µs med=3.26µs max=794.94ms p(90)=5.25µs p(95)=7.59µs
 http_req_connecting............: avg=21.04µs min=0s med=0s max=137.87ms p(90)=0s p(95)=0s
 http_req_duration..............: avg=12.53ms min=87.32µs med=7.41ms max=505.49ms p(90)=30.11ms p(95)=41.76ms
 http_req_failed................: 0.00% ✓ 0 ✗ 2130934
 http_req_receiving.............: avg=144.8µs min=7.68µs med=25.1µs max=443.47ms p(90)=42.84µs p(95)=59.89µs
 http_req_sending...............: avg=188.63µs min=0s med=25.23µs max=496.16ms p(90)=43.88µs p(95)=63.57µs
 http_req_tls_handshaking.......: avg=0s min=0s med=0s max=0s p(90)=0s p(95)=0s
 http_req_waiting...............: avg=12.2ms min=0s med=7.25ms max=477.31ms p(90)=29.56ms p(95)=40.8ms
 http_reqs......................: 2130934 31509.773005/s
 iteration_duration.............: avg=16.42s min=7.89s med=16.33s max=21.85s p(90)=19.75s p(95)=20.16s
 iterations.....................: 1999 29.558886/s
 vus............................: 179 min=179 max=500
 vus_max........................: 500 min=500 max=500
Now k6 is pushing just under 32k requests per second, right at half of the Speedscale generator under similar conditions using real traffic.
Faster Than k6?
So why is the Speedscale load generator so fast? How can we process real traffic faster than other load generators?
Pure Go
We pretty much get this one for free. Our implementation is pure Go while k6 uses goja to provide javascript as a scripting language. goja is tremendously fast, but the overhead still exists.
Keep it simple
For starters, our generator is pretty simple, or at least simple compared to what it needs to do.
As you might expect, the loop for a single VU looks something like this:
- get the next RRPair (request / response data type used to pass recorded traffic around)
- perform any necessary transformations like changing timestamps or re-signing JWTs
- build and make the request
- record the response
Each VU runs in a separate goroutine with little indirection and as few allocations as possible. We have been careful when adding any behavior to this tight loop to keep things speedy.
Optimizations
Of course, we’ve profiled our load generator and found cheap optimizations. Most of these are what you would expect. Re-using HTTP clients between requests (within the same VU), an async pipeline for recording responses, resource pools, and fully separate resources for each VU so there’s no contention between them over the same resources.
We’ve also made configuration changes like tuning the HTTP client for our specific case.
But these are all miniscule compared to the recent removal of Redis. We were using Redis as a cache, a common use case, without realizing it did not match our access patterns. Redis provides access to any record in the set based on a key, but we always run from the first recorded request to the last. Instead we can open the same flat file in read-only mode from each VU and just read serially, which increased our overall throughput 2x! In retrospect it makes sense. If each network request (SUT) requires a network request (Redis) then half of our time is spent just getting the requests that need to be made.
Let’s be clear. We love k6 and appreciate all the great work Grafana has done, and then released for free. But while there is some overlap, Speedscale aims to solve a different set of problems than an open source, scriptable load testing tool by fully simulating production environments. This is just an interesting comparison point for those using k6 today and wondering what’s possible.
What’s Next
Right now we are working on changes to the load characteristics during the replay. Scaling up load more slowly, and then back down can test autoscalers and find memory leaks. Targeting a certain number of requests per second gives services a solid target for a load test rather than just hitting a service until it falls over or trying to guess the number of VUs to get the same effect. And as always we’re working to make the general experience our customers get from viewing and replaying traffic better.