How Iceberg Tables Work In Snowflake | Demo

Iceberg Tables, a new type of Snowflake table available in preview, pairs Snowflake’s powerful performance engine and platform capabilities with open formats in external storage. In this video, you will get:❄ An overview of Apache Iceberg❄ A demo showing how Iceberg Tables support interoperability between different tools❄ A technical deep dive on how Iceberg Tables work in Snowflake Links to Iceberg resources.

The Top 3 reasons you need Talend Data Catalog 8

The growth of big data has scattered data sources throughout the enterprise, tucking them away in silos and making them hard to find. But there is more to data than just storing information in an operational data store or running analytics from a data warehouse. For example, regulated industries have requirements needing tighter control over the data.

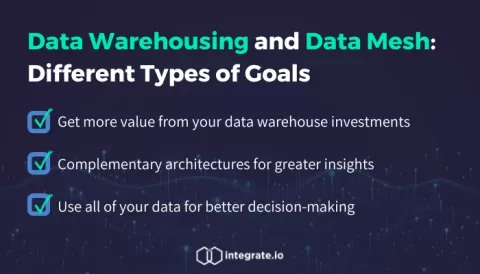
Data Warehousing and Data Mesh: Different Types of Goals

The world is full of different types of goals. Consider football. The goal in football is at the end of the field. A runner either crosses the goal or they don't, when trying to make a touchdown. Or, consider basketball. In basketball, when a player shoots the ball, the player’s shot either goes through the net or it doesn’t. Alternatively, consider ice hockey. When a hockey player shoots the puck, it either goes into the net — or it doesn’t.

What is DataOps? Leveraging Telemetry Data for Product-Led Growth

Any data-driven organization will tell you that the holy grail is faster time to insights. But the unfortunate truth is that business users often have to wait days — even weeks or months — to analyze the data they need. Behind the scenes, data engineering teams put a lot of work into joining disparate datasets, creating pipelines, and delivering a final data product back to their stakeholders for analysis.

SaaS in 60 - Natural Language Insights on Dashboards

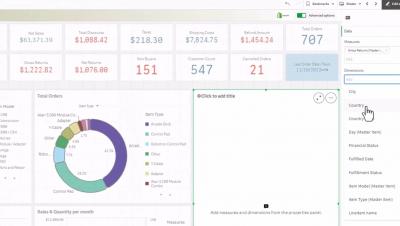
You can now deliver AI-generated, natural language insights directly on sheets in Qlik Sense. With our new natural language object, you can include narrative interpretations and readouts for any context, such as an overall sheet, a group of visualizations, or an individual visualization. This capability allows all Qlik Sense users to benefit from NLG when exploring in dashboards, boosting data literacy and driving improved data storytelling.