How to Measure the Impact of a Product Launch With AI and Your Notion Specs

To measure the impact of a product launch, grade it against the target written in its spec. Every launch spec names a metric, a target and a time window. Once the window closes, the launch either hit that target or missed it. Before then, it’s too early to call. The hard part is getting the target and the result into the same view, because the target lives in Notion and the result lives on your dashboard.

Why did our pipeline drop? How to find the cause in your HubSpot deal notes with AI

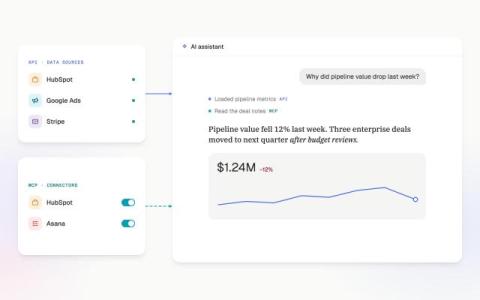
Open pipeline drops when deals leave it (closed won, closed lost or pushed out of the period) or when fewer new deals come in. Your CRM dashboard shows which of those happened. The reason behind it sits in HubSpot, in the notes, emails and call logs on the deals themselves. To find it in one question, ask an AI analyst that can read both. With the HubSpot MCP connector, Genie, the Databox AI Analyst, traces the drop to the deals behind it and tells you what the reps wrote about them.

MCP vs. API: What's the difference for AI analysis?

Businesses have long used APIs to connect their software applications and exchange data. These connections power many of the tools companies rely on for reporting, allowing them to bring information from different systems into one place and keep their reports up to date. Now, AI assistants like ChatGPT and Claude can connect to those same business applications through MCP (Model Context Protocol), making it easier to access information and perform tasks using natural language.

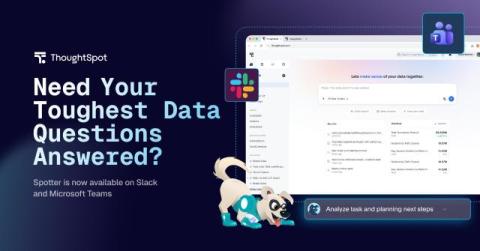
Spotter Is Now Available in Slack and Microsoft Teams

Let’s say a regional sales director posts a soft renewal number in the channel. A teammate asks the question that decides the plan: trend, or seasonal blip? Nobody in the thread can answer, so the thread does what threads do. It moves on, and the plan gets anchored to the most confident opinion in the room. The maddening part: the data existed. It was modeled, governed, correct, sitting in the warehouse the whole time. It's not a data problem; the answer was there.

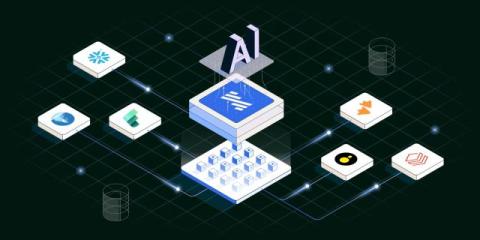
New Forrester study: Why modernizing data streaming is about more than cost savings

A new Forrester Total Economic Impact (TEI) study commissioned by Confluent, an IBM company and data streaming platform, found that a representative composite organization achieved 137% ROI, USD 2.1 million in net present value and a 10-month payback period. Those are meaningful results. The ROI is notable. What's more interesting is where the value came from. Modernization is often framed as an infrastructure problem. Leaders compare platform costs, migration and operating costs.

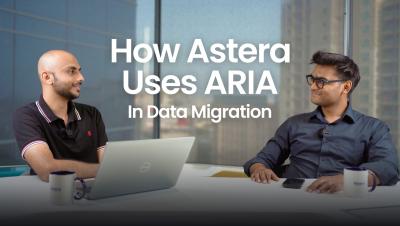
How Astera Uses ARIA: Data Migration

Moving the data is the easy part. Planning is where data migrations go wrong. Sudais (Growth Strategist) sits down with Nabeel Farooqui (Lead Software Engineer), to talk about how Astera uses ARIA on data migration projects, and what changes when you describe the goal to an agent instead of facing a blank canvas. Nabeel has run migrations with and without ARIA. He explains where projects usually go wrong, how ARIA handles the setup in Centerprise, how to validate the pipeline it builds, and the best practices he's learned along the way.

The Security Domino Effect: Why Trust Can't Be an Afterthought in AI

In interconnected software environments, a security vulnerability rarely exists in isolation. A weakness in one component can expose credentials, create unintended access paths, or give attackers a foothold in connected services. The consequences depend on what that component can access, the permissions it holds, and the safeguards around it. As organizations adopt cloud platforms, third-party integrations, and AI-powered development tools, the boundaries between systems matter more than ever.

Why Did My Organic Traffic Drop? How to Find the Cause With AI and Your Semrush Data

Organic traffic usually drops for one of four reasons: a competitor took your rankings, keywords slipped out of the top 10, a technical issue appeared on your site, or you lost backlinks. Your SEO dashboard shows when the drop started. The reason sits in Semrush, split across Position Tracking, Organic Research, the backlink reports and the site audit. Finding it means opening four reports, exporting four files and lining them up against your traffic chart in a spreadsheet.