Systems | Development | Analytics | API | Testing

Observability

Data Mesh: Promoting Data as Products

The Data Mesh is a fascinating approach to designing and developing data architectures – and it’s generating a lot of attention and discussion in the data world. The concept, introduced by Zhamak Dehghani, challenges the status quo idea of a centralized, monolithic data architecture. Instead, advocating for a decentralized domain-driven design.

Dynamic Observability - The Quest For Real-Time Debug Data

Rookout’s Dynamic Observability platform enables engineers to get instant code-level data and troubleshoot their cloud-native applications easier and faster, without adding code or waiting for a new deployment. But we’ll let this video speak for itself - take a look to learn what Rookout can do for you in your quest for debug data.
Sponsored Post

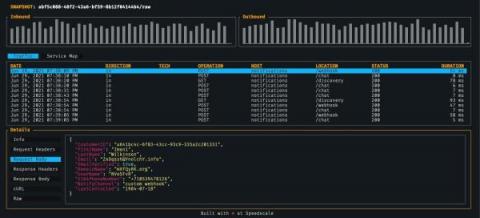
Speedscale Launches CLI: Free API Observability Tool

We are excited to announce the launch of Speedscale CLI, a free observability tool that inspects, detects and maps API calls on local applications or containers. The offering underscores the importance of continued and proactive API testing to quickly detect and debug defects within a shifting array of upstream and downstream interdependencies.

REST API Observability for Python

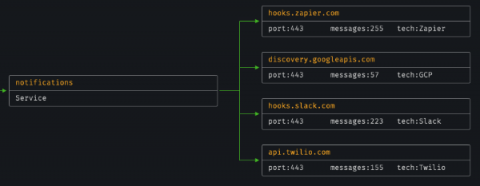
In this blog post we’ll help answer the age old question, “What does this service talk to and what does it say?” We’ll see how to inspect inbound and outbound REST API calls to see what calls are being made and what incoming traffic causes a reaction. This can be pretty handy when you’re taking over maintenance of an existing service, or if your code just isn’t behaving the way you expect.

Building Smart O11y for Kuma With Elastic Observability

This blog was co-created by Ricardo Ferreira (Elastic) and Viktor Gamov (Kong). We love our microservices, but without a proper observability (O11y) strategy, they can quickly become cold, dark places cluttered with broken or unknown features. O11y is one of those technologies deemed created by causation: the only reason it exists is that other technologies pushed for it. There wouldn’t be need for O11y if, for example, our technologies haven’t gotten so complex across the years.

Using Elastic ML to Observe Your Kuma API Observability Metrics

Observability is catching on these days as the de-facto way to provide visibility into essential aspects of systems. It would be unwise for you not to leverage it with Kuma service mesh — the place that allows your services to communicate with the rest of the world. However, many observability solutions restrict themselves to the works: simple metric collection that provides them with dashboards. Expecting users to simply sit on their chairs and look at those metrics all day long is an invitation to failure, as we know that one can only do so much when they get tired and bored.

Introducing Dynamic Observability: A no-code integration between Elastic and Rookout

In recent years, Observability has become a de-facto standard when discussing development and maintenance of cloud-native applications. The need to develop an observable system and ensure that as it runs in production, engineers will be able to detect performance issues, downtimes, and service disruptions, has evolved into a rich ecosystem of tools and practices.

Application Observability With Kuma Service Mesh

The more services you have running across different clouds and Kubernetes clusters, the harder it is to ensure that you have a central place to collect service mesh observability metrics. That’s one of the reasons we created Kuma, an open-source control plane for service mesh. This tutorial will show you how to set up and leverage the Traffic Metrics and Traffic Trace policies that Kuma provides out of the box.