Systems | Development | Analytics | API | Testing
Observability
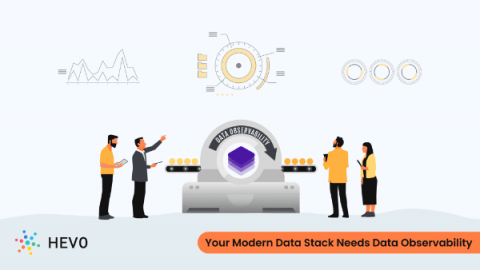
Data 'Poka-Yoking' With Data Observability for the Modern Data Stack
Kensu launches first 360 data observability solution to monitor data in motion and at rest in real-time
Transforming Kong Logs for Ingestion into Your Observability Stack
As a Solutions Engineer here at Kong, one question that frequently comes across my desk is “how can I transform a Kong logging plugin message into a format that my insert-observability-stack-here understands, i.e. ELK, Loki, Splunk, etc.?” In this blog, I’m going to show you how to easily accomplish converting a Kong logging payload to the Elastic Common Schema. In order to accomplish this task, we’re going to be running Kong Gateway in Kubernetes and using two Kong plugins.
Kensu partners with Collibra to automate data catalog completion
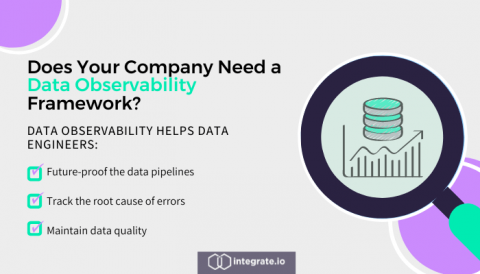
Does Your Company Need a Data Observability Framework?
Enhance Observability with Opentelemetry tracing - Part 1
Recently, conversations have been increasing around OpenTelemetry; it is gaining more and more momentum in Node.js development circles, but what is it? How can we take advantage of the key concepts and implement them in our projects? Of note, NodeSource is a supporter of OpenTelemetry, and we have recently implemented full support of the open-source standard in our product N|Solid. It allows us to make our powerful Node.js insights accessible via the protocol.
Unravel Automated Data Quality Datasheet
Unravel now pulls in data quality checks from external tools into its single-pane-of-glass full-stack observability view.
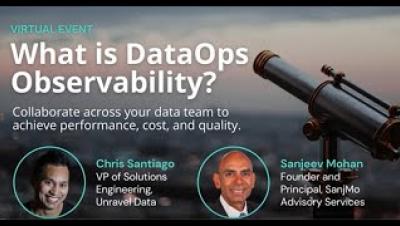
Get Ready for the Next Generation of DataOps Observability
I was chatting with Sanjeev Mohan, Principal and Founder of SanjMo Consulting and former Research Vice President at Gartner, about how the emergence of DataOps is changing people’s idea of what “data observability” means. Not in any semantic sense or a definitional war of words, but in terms of what data teams need to stay on top of an increasingly complex modern data stack.
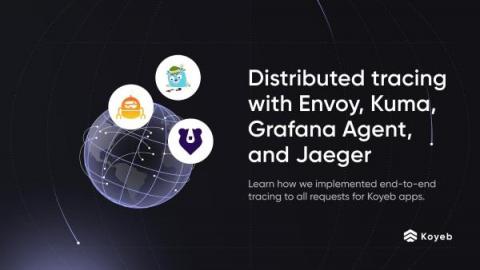
Distributed tracing with Envoy, Kuma, Grafana Agent, and Jaeger
As a cloud service provider, observability is a critical subject as it's strongly related to the availability of the services running on the platform. We need to understand everything that is happening on our platform to troubleshoot errors as fast as possible and improve performance issues. A year ago, while the platform was still in private beta, we faced a tough reliability issue: users were facing random 500 errors when accessing their applications.


