Systems | Development | Analytics | API | Testing

7 Finance Reporting Nightmares: Banish Your Fears

If financial reporting nightmares are keeping you up at night, you’re not alone. As the long hours exporting data, running reports, and fixing errors cast dark shadows over your days, take heart and get clear insights into your data with these tips. With tools and processes that save you time, you can mark yourself safe from these scary financial reporting situations.

How to Solve Enterprise Reporting Challenges with Server-Side Processing

It’s 2 AM after the export workflow failed again. Your users are still waiting for their invoices because your team is in the office manually reformatting 500 of them. By morning, their compliance officer is busy calling when the system times out trying to generate a 100-page report. And before you’ve even had coffee, your biggest customer questions data accuracy because last month’s statement looks nothing like this month’s. The cost?

Jet Reports: Fast Reporting Performance

If you are looking for a reporting solution that can handle complex data and deliver fast results, you might want to check out Jet Reports from insightsoftware. Jet Reports is a powerful Excel-based reporting tool that directly connects to your Microsoft Dynamics ERP and allows you to create custom reports and dashboards with ease using real-time data. Jet Reports is designed to make your reporting experience fast and smooth.

Why Pixel Perfect Reporting Is Critical for Enterprise Operations (And How to Scale It)

After spending hours perfecting your BI dashboard, you export a report only to watch headers shift, page breaks split tables, and logos resize unpredictably. What should take minutes becomes hours of manual reformatting before documents meet compliance standards. This repeats daily across enterprises. Modern BI platforms optimize for responsive dashboards that adapt to screens, but operational documents require absolute precision.

ERP Data Struggles: How To Get Real-Time Reporting in Excel

You can never have too much data, right? But sometimes it feels like that’s the problem when you’re trying to get your enterprise resource planning (ERP) system to play nice with Excel and quickly give you the reports you need. It’s a common challenge for finance teams, and you can fix it. Creating a bridge to make all that ERP data easily accessible in Excel is the key to getting the business intelligence (BI) reports you need quickly.

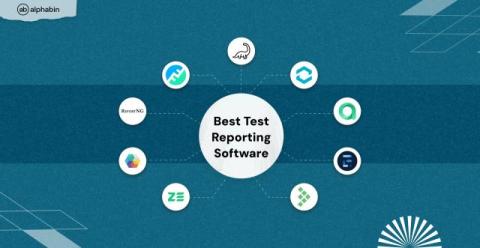
Best Test Reporting Software

It’s 2 AM. Your release just broke again. CI pipelines were green, tests appeared clean, and the dashboard looked harmless. Yet, staging is down, and no one knows why. You're staring at static HTML reports and generic error logs. They show what failed, but give no clue why, no context, no trace, no help. It's like debugging in the dark. This is what outdated test reporting costs: lost hours, broken releases, and reactive firefighting when you should be sleeping or shipping.

Saving Time in Complex Financial Reporting

Still relying on spreadsheets? For many finance teams, reporting remains a slow, manual grind—like trying to run a marathon in flip-flops. It’s possible, but exhausting and inefficient. In today’s fast-paced business world, where agility and accuracy are non-negotiable, manual processes simply can’t keep up. Bottlenecks, duplicated efforts, and error-prone data handling drag down progress and divert your team’s talent away from higher-impact work.

Analytics vs. Reporting: How Are They Different and Why You Should Focus on Both

Analytics and reporting can help businesses transform data into actionable insights, identify customer behavior patterns, measure each department’s performance, and improve operational efficiency. And this is just the tip of the iceberg. However, while these two terms are often used interchangeably, they represent different approaches to understanding and communicating data.

Webinar Reporting Made Easy: How to Combine Zoom + HubSpot Data for Clear Insights

Struggling to report on webinar performance in a way that actually makes sense to your exec team? Ali Schwanke from @SimpleStrat built a clean, custom dashboard that merges Zoom and HubSpot data—giving her full visibility into webinar ROI. In this video, you'll see how she tracks attendance, first-touch conversions, lead source attribution, and more over time. By blending registration, engagement, and survey data from Zoom with lifecycle insights from HubSpot, she reveals which webinars drive results—and why.

HubSpot Reporting Dashboards Used by Revenue Experts: Real Templates, Pro Tips

As a current HubSpot user and veteran of a HubSpot partner agency, I know first-hand how powerful HubSpot is. And they’ve built a lot of great reporting enhancements into the platform over the last few years. And yet – we still hear that even the best HubSpot power users run into limitations (in functionality, pricing, or both).