
Systems | Development | Analytics | API | Testing

Introducing Applied Machine Learning Prototypes

Applied Machine Learning Prototypes (AMPs) are open source projects that will fundamentally change the way data scientists build, deploy, and monitor ML models. These fully-developed prototypes are built around common industry use cases — like Churn Prediction Monitoring, Anomaly Detection, and more — and can be customized to give you significant head start. Available in Cloudera Machine Learning, AMPs are tested, trusted, and research backed by Fast Forward Labs.

What is the Impact of Using a Business Analytics Dashboard?

It's common knowledge today that business intelligence (BI) dashboards are powerful tools that can help you track and analyze your business performance, identify trends and patterns, and make better decisions based on data, not gut feeling. There several benefits to using a business intelligence dashboard, and it can have a big impact on your business.

Monitoring in Edge Flow Manager | Observability with Grafana

This video explains Edge Flow Manager (EFM) integration with Prometheus and Grafana. After installing and configuring Prometheus to scrape, EFM should also be configured to expose metrics. When the time series are in place, Grafana is also installed and configured to visualize exposed metrics. There are some EFM specific Grafana dashboards that are publicly available that can be easily downloaded and imported to Grafana. When everything is configured correctly agent specific dashboards can be accessed from the EFM UI.

How to Choose the Best Data Visualization for Your Reporting

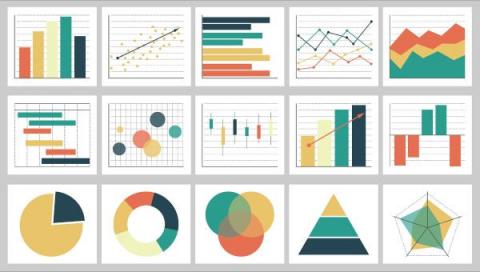
Data visualization involves visually imparting information to communicate complex data. Graphics such as charts help simplify data so more people can understand the insights embedded within a dashboard or report. Businesses use data visualizations to find and highlight patterns and trends in big data sets, with many data visualization examples available today, including graphs, maps and plots to help others grasp data conveniently.

Sustainability Reporting: A Modern Finance Imperative

ESG reporting is rapidly becoming a key focus area for finance teams around the world. ESG stands for “environmental, social, and governance.” It’s a set of standards through which companies can report metrics that indicate how well their activities align with issues of environmental stewardship and social issues. In late 2021, the International Accounting Standards Board (IASB) announced the creation of a new ESG reporting standard.

Zero-ETL approach to analytics on Bigtable data using BigQuery

Modern businesses are increasingly relying on real-time insights to stay ahead of their competition. Whether it's to expedite human decision-making or fully automate decisions, such insights require the ability to run hybrid transactional analytical workloads that often involve multiple data sources. BigQuery is Google Cloud’s serverless, multi-cloud data warehouse that simplifies analytics by bringing together data from multiple sources.

Applying Fine Grained Security to Apache Spark

Apache Spark with its rich data APIs has been the processing engine of choice in a wide range of applications from data engineering to machine learning, but its security integration has been a pain point.t Many enterprise customers needi finer granularity of control, in particular at the column and row level (commonly known as Fine Grained Access Control or FGAC).