Systems | Development | Analytics | API | Testing

Blog

Analyzing Python package downloads in BigQuery

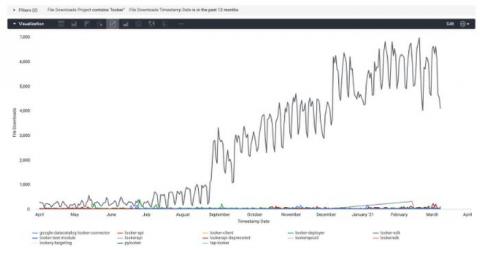
The Google Cloud Public Datasets program recently published the Python Package Index (PyPI) dataset into the marketplace. PyPI is the standard repository for Python packages. If you’ve written code in Python before, you’ve probably downloaded packages from PyPI using pip or pipenv. This dataset provides statistics for all package downloads, along with metadata for each distribution. You can learn more about the underlying data and table schemas here.

Top Java Software Errors: 50 Common Java Errors and How to Avoid Them

Imagine, you are developing Java software and suddenly you encounter an error? Where could you have possibly gone wrong? There are many types of errors that you will encounter while developing Java software, but most are avoidable. Some errors are minor lapses when writing codes but that is very much mendable. If you have an error monitoring tool such as Stackify Retrace, you can write codes with ease.

FRTB: Will 2023 Finally be the Year?

The Fundamental Review of the Trading Book (FRTB), introduced by the Basel Committee on Banking Supervision (BCBS), will transform how banks measure risk. FRTB is designed to address some fundamental weaknesses that did not get addressed in the post-2008 financial crisis regulatory reforms. In order to help make banks more resilient to drastic market changes, it will impose capital requirements that are more closely aligned with the market’s actual risk factors.

Why DataOps is Critical for Your Business

Data is often compared to oil – it powers today’s organizations, just like the fossil fuel powered companies of the past. Just like oil, the data that companies collect needs to be refined, structured, and easily analyzed in order for it to really provide value in the form of gaining actionable insights. Every organization today is in the process of harnessing the power of their data using advanced analytics, which is likely running on a modern data stack.

The Easiest Way to Monitor Ruby: Automatic Instrumentation

Setting up a proper monitoring overview over your application’s performance is a complex task. Normally, you’d first need to figure out what you need to monitor, then instrument your code, and finally make sense of all the data that has been emitted. However, with a few things set in place, and an APM that natively supports Ruby, it’s easier than ever to take this step. In this post, we’ll show you how you can do it too.