Systems | Development | Analytics | API | Testing
Monitoring
How to Monitor Core Web Vitals for your Website with Alerts and Reports
The experience your customers get once they enter your website can be a game changer for your online business in terms of sales, revenue, customers interaction and overall experience. Once you release new features for your website or blog, or once you add new plugins or widgets, add new styles, animations or functionality, all these can affect the Performance, SEO or Accessibility of your website.
Microservices Monitoring and Logging with Kong Konnect
2 Approaches to Microservices Monitoring and Logging
We’re seeing a massive shift in how companies build their software. More and more, companies are building—or are rapidly transitioning—their applications to a microservice architecture. The monolithic application is giving way to the rise of microservices. With an application segmented into dozens (or hundreds!) of microservices, monitoring and consolidated logging become imperative.
APM With Prometheus and Grafana on Kubernetes Ingress
While monitoring is an important part of any robust application deployment, it can also seem overwhelming to get a full application performance monitoring (APM) stack deployed. In this post, we’ll see how operating a Kubernetes environment using the open-source Kong Ingress Controller can simplify this seemingly daunting task! You’ll learn how to use Prometheus and Grafana on Kubernetes Ingress to simplify APM setup.
APM with Prometheus and Grafana on Kubernetes Ingress
Chaos testing with k6, Prometheus, and Grafana (Schrödinger's Pokémon)
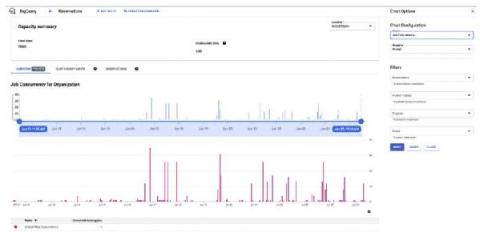
Monitoring in BigQuery
BigQuery Admin reference guide: Monitoring
Last week, we shared information on BigQuery APIs and how to use them, along with another blog on workload management best practices. This blog focuses on effectively monitoring BigQuery usage and related metrics to operationalize workload management we discussed so far.


