Systems | Development | Analytics | API | Testing

3 Ways to Break Down SaaS Data Silos

Access to data is critical for SaaS companies to understand the state of their applications, and how that state affects customer experience. However, most companies use multiple applications, all of which generate their own independent data. This leads to data silos, or a group of raw data that is accessible to one stakeholder or department and not another.

Enhance Clarity with BugSnag's Upcoming Real User Monitoring Capabilities

SmartBear is excited to announce the upcoming beta for real user monitoring, a new facet of BugSnag’s observability stack. BugSnag is a full-stack monitoring solution delivering real-time data to improve app performance and help you balance roadmap agility with application stability.

From Silos to Collaboration: How to Democratize Data in Product Analytics

Companies who develop software products generate massive quantities of product performance and user engagement data that can be analyzed to support decision-making about everything from feature planning and UX design to sales, marketing, and customer support.

5 Ways to Use Log Analytics and Telemetry Data for Fraud Prevention

As fraud continues to grow in prevalence, SecOps teams are increasingly investing in fraud prevention capabilities to protect themselves and their customers. One approach that’s proved reliable is the use of log analytics and telemetry data for fraud prevention. By collecting and analyzing data from various sources, including server logs, network traffic, and user behavior, enterprise SecOps teams can identify patterns and anomalies in real time that may indicate fraudulent activity.

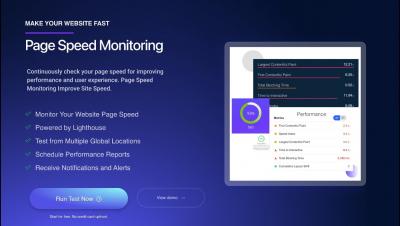
Page Speed Monitoring | Website Speed Test | LoadFocus

Boost Your Website Performance with LoadFocus Page Speed Monitoring 🚀 As a website owner, ensuring your website loads quickly and smoothly is crucial for a better user experience and improved search engine rankings. With LoadFocus Page Speed Monitoring, you can easily create new tests,

Appian Protect: Security Monitoring, End-to-End Encryption, and More

Data is the heart of business operations. And much of that data is sensitive or regulated. Cyber threat actors know they can benefit financially from your data by holding it for ransom or selling it on the dark web. The most recent Cost of a Data Breach Report 2022 from Ponemon Institute and IBM clocks the average data breach cost at $4.35 million USD (that’s $164 USD per data record). The stakes are high. Your security must be too.

What Is the Difference Between Observability and Monitoring?

The practice of DevOps — development operations — has taken organizations by storm. According to a 2021 report by Redgate Software, 74 percent of enterprises surveyed say they now use DevOps in some form or fashion, compared with just 47 percent in 2016. DevOps practitioners seek to improve the software development lifecycle by fostering closer collaboration between developers and IT operations teams.

Monitoring APIs with Grafana

Now that we have explored monitoring apis with Prometheus, let’s take a look at monitoring our APIs with Grafana. You may have noticed from the previous blog that Prometheus is awesome, but takes some time to fully flesh out and their dashboards aren’t easy to read or very eye-catching. Luckily for us, Grafana specializes in data visualization. We won’t even have to configure all our Prometheus queries, so let’s get started.