Data Visualization Tools vs Data Analytics: What's the Difference?

Data visualization tools are dedicated software applications or components of a business intelligence (BI) solution that visually render data and present information through various formats, like graphs, charts, or heat maps - and an important parts of analytics today. The best data visualization tools are those that provide a diverse range of visualization options that represent complex data across multiple use cases, and help end-users easily analyze it.

How To Improve Data Observability for Better Business Insights

Here are five things to know about data observability: Data observability solves many of the issues of modern data infrastructure. Still, few Ecommerce organizations understand this process or how to improve it. Here's what you need to know: Data observability, in a data science context, helps you understand the current state of all the data in your Ecommerce enterprise. It monitors and manages any problems that might occur during the data integration process.

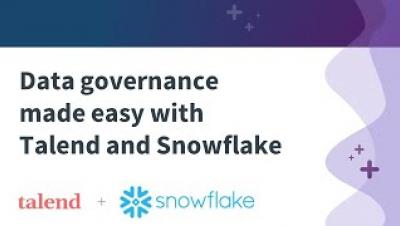
Data governance made easy with Talend Data Stewardship and Snowflake Data Cloud

Data governance made easy with Talend Data Stewardship, a self-service business application, and Snowflake Data Cloud. Watch as solution experts Michael Titheridge from Talend & Marko Slabak from Snowflake walk you through the latest Talend has to offer with cloud ingestion tools, building up data models quickly in Pipeline Designer, and then applying semantic types and cleaning the data as a data arbitrator in Data Stewardship to build an effective governance layer on Snowflake.

Big Data and AI Blame Failures on Bad Data

Guest post by Bill Inmon “Bill Inmon is an American computer scientist, recognized by many as the father of the data warehouse. Inmon wrote the first book, held the first conference, wrote the first column in a magazine, and was the first to offer classes in data warehousing.” Source: Wikipedia. An article headline — “BIG DATA/AI BLAME FAILURES ON BAD DATA” — caught my attention.

Should you Build or Buy Your Data Parsing Tool?

Before we dive deeper into data parsing tools, we must understand what parsing means. Consider the following sentence: The adept software parsed the problematic data. Intuitively, we all understand what this means, but what if we broke it down into a simpler format? The process of dividing this sentence into its subject, verb, and object is known as linguistic parsing. By performing linguistic parsing, readers can better understand the intention behind an author’s words.

When is it Time to Upgrade Your Data Visualization Software?

Analytics and data visualization are essential parts of modern business intelligence (BI). These tools help you better understand your business and improve overall decision-making. However, as your data grows and your users' analysis needs evolve, it may be time to upgrade your visualization solution to achieve better capability and reporting.