

Systems | Development | Analytics | API | Testing

Bringing Dark Data to Light

At least every few years, utility companies release squadrons of drones into the skies to digitally photograph hard-to-reach equipment and check for wear and tear. Around the world, there are 3 million miles of high-voltage transmission lines – enough to go from the moon and back half-a-dozen times – and as much as 64 million miles of local transmission lines; that represents a lot of images, and even more data.

Built with BigQuery: Material Security's novel approach to protecting email

Since the very first email was sent more than 50 years ago, the now-ubiquitous communication tool has evolved into more than just an electronic method of communication. Businesses have come to rely on it as a storage system for financial reports, legal documents, and personnel records. From daily operations to client and employee communications to the lifeblood of sales and marketing, email is still the gold standard for digital communications.

6 Signs You Have the Wrong Business Intelligence Platform

If you’re in business, you’ve probably already heard of business intelligence (BI) tools. With the use of embedded analytics, BI helps organizations improve decision making and planning by providing them with a valuable way to manage, analyze, and visualize data that is often difficult to access or even find. Spreadsheets and ad-hoc reporting are now a thing of the past. When used correctly, it can be a great way to help you keep your finger on the pulse of your business.

How Snowflake Support Uses Data to Improve the Customer Experience

Customer advocacy is one of the Snowflake Support team’s most important roles. Working closely with customers around the world every day, we listen and learn to gain meaningful insights into Snowflake products, the ways our customers use those products, and the challenges they face. We feel a deep responsibility to take those insights and trends, analyze them, and drive positive change on behalf of Snowflake customers.

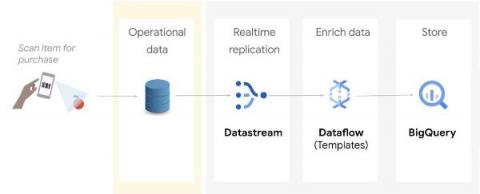
Unlock real-time insights from your Oracle data in BigQuery

Relational databases are great at processing transactions, but they’re not designed to run analytics at scale. If you're a data engineer or a data analyst, you may want to continuously replicate your operational data into a data warehouse in real time, so you can make timely, data driven business decisions.

Canadian Tire x ThoughtSpot

Building trust is extremely important, and Canadian Tire does this using data. Through having an in depth understanding of the numbers, Canadian Tire is now able to build trust with their merchants. See how with ThoughtSpot’s simple, search based platform, Canadian Tire can now better understand their customers and continue to scale.

Becoming AI-First: How to Get There

Deciding to adopt an AI-first strategy is the easy part. Figuring out how to implement it takes a little more effort. It requires a clear-eyed vision built around well-defined goals and a realistic execution plan. Being AI-first means setting up your organization for the future. By leveraging data, analytics, and automation, a company can gain a better understanding of where it is and where it needs to go.

The Best Time to Kickstart your Data Strategy is Now

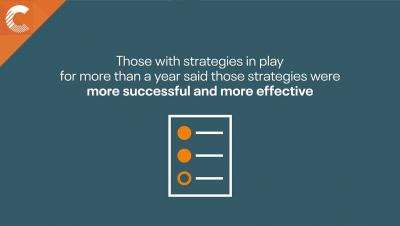
Organizations with data strategies in play for more than a year found that those strategies were more successful and more effective. Cindy Maike, VP of Industry Solutions and Value Management explains how kickstarting your data strategy now will help your business meet unforeseen challenges to the industry.

SaaS in 60 - Chart-level Scripting

This week we introduce a powerful new capability that allows you to provide and manipulate data directly within a chart object using script. Chart Level Scripting allows users to modify the data set behind a chart using a subset of the Qlik scripting language, using techniques such as variables and loops. Rows and columns can be added or modified that were not in the original data set enabling calculations that have previously not been possible in chart expressions or with variables. Simply enable the app for chart scripts, under measures add your script under the script section – and along with the appropriate dimensions– you will see your charts reflect the data provided by the script which also can be changed in real-time with the use of variables and expressions. Offering a new way to analyze your data such as simulations and goal seeking.