Systems | Development | Analytics | API | Testing

The Top 21 Grafana Dashboards & Visualisations

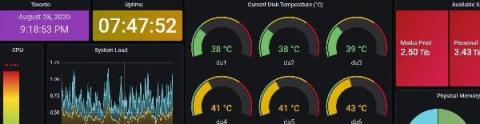
In our guide on the best Grafana dashboards examples, we wanted to show you some of the best ways you can use Grafana for a variety of different use cases across your organisation. Whether you are a software architect or a lead DevOps engineer, Grafana is used to make analysis and data visualisation far easier to conduct for busy engineering and technical teams throughout the world.


Why you need metadata management and how to approach it

As your data operations evolve, they become messier. Diverse data sources and data models at their sources, multiple movements of data throughout your platform, and cobbled-up infrastructure, which has grown in complexity through every deployment have made it hard to identify, trace, classify, and understand your data assets. This can be as simple as an analyst spending hours trying to figure out where a data attribute in a table came from and whether it is trustworthy.

Differences between N|Solid SaaS and On-Prem

N|Solid SaaS is focused on small and medium-sized companies that want to start monitoring their Node.js processes. N|Solid SaaS Runs on our servers. It requires communication with our infrastructure, and we control it. You don’t need to install anything, and you can configure your processes with only three simple steps. There are three options for your SaaS plan, and you can choose the one that works best for your needs.