Systems | Development | Analytics | API | Testing

How businesses use automated monitoring

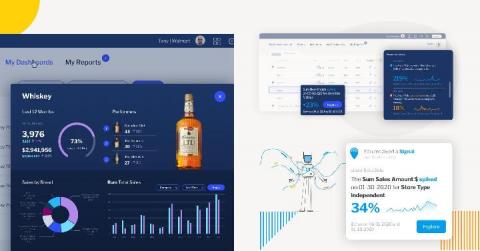
One of the big trends we’ve seen this year is organizations going direct to consumer. Manufacturers who sold through retail outlets are moving online, and as a result a huge amount of digital transformation is occurring. A customer of ours has done exactly that. Kyowa is a Japanese cosmetics and health food company and they’ve moved from retail to online and digital, and Yellowfin has been a significant part of that journey. In particular, they’ve used Signals.


Anodot the business monitoring platform

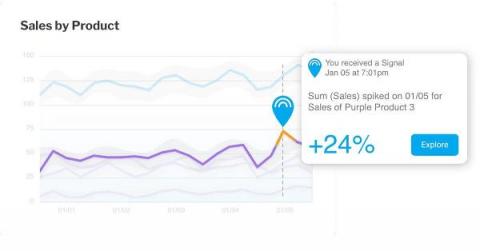
Business metrics are notoriously hard to monitor because of their unique context and volatile nature. Anodot’s Business Monitoring platform uses machine learning to constantly analyze and correlate every business parameter, providing real-time alerts and forecasts in their context. This is machine learning packaged in a turn-key solution – no data science experience needed.

Dashboards vs automated business monitoring: What's the difference?

In 2020, however, contining to rely just on dashboards for your BI needs isn't enough. Why? Data is growing exponentially - in both size and complexity - within every business today. Manually keeping track of performance and searching for insights has become difficult for many users, and it's fostered new expectations - to be able to do more with analytics - including making it faster and easier to keep on top of changes or opportunities.

Introducing the Apache Kafka App Catalog

Working with Apache Kafka and real-time applications comes with challenges. Visibility into the deployed applications and their dependency on what we call the “data fabric” is one of them (For the sake of this blog, it means Kafka and all its state and configuration). If you’ve built a multi-tenant real-time data platform with Kafka, where teams are deploying applications outside your jurisdiction, this is where the pain is particularly acute. It goes something like this.

Tracing With Zipkin in Kong 2.1.0

There is a great number of logging plugins for Kong, which might be enough for your needs. However, they have certain limitations: Most of them only work on HTTP/HTTPS traffic. They make sense in an API gateway scenario, with a single Kong cluster proxying traffic between consumers and services. Each log line will generally correspond to a request which is “independent” from the rest.

Observability For Your Microservices Using Kong, Kubernetes, and Prometheus

In this video, Kevin Chen, Developer Advocate at Kong, will explain how to set up Prometheus monitoring with Kong Gateway to get black box metrics and observability for all of your services deployed on Kubernetes. This guide can also be applied to other solutions like StatsD, Datadog, Graphite, InfluxDB etc.

It Takes Two to Kafka: AWS MSK + DataOps

I ordered a ride share recently from a beach; the app struggled to find a car, so I had to make several requests. After the fourth or fifth attempt, my bank alerted me to possible fraudulent activity on my credit card via SMS. Each time I ordered a ride, the service put a pending charge on my card. After I texted back that it was just me, the bank reactivated my account. Though the process was annoying, I felt reassured my bank could detect possible fraudulence that quickly.