Systems | Development | Analytics | API | Testing
Dashboards
Logit.io Announces The Beta Launch Of Hosted Grafana
We are pleased to announce the beta launch of hosted Grafana in addition to our existing ELK as a Service & hosted Open Distro services. As organisations around the world are constantly looking for ways that they can ensure compliance is being upheld, speeding up Mean Time To Repair (MTTR) and reducing the risk of DDoS attacks, managed Grafana forms a vital role in improving metrics observability across the entirety of your infrastructure.
What Are the Limitations of Dashboards?
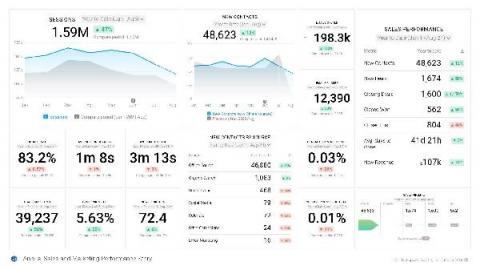
For modern businesses faced with increasing volumes and complexity of data, it’s no longer efficient or feasible to rely on analyzing data in BI dashboards. Traditional dashboards are great at providing business leaders with insights into what’s happened in the past, but what if they need actionable information in real time? What if they want to use their data to estimate what may happen in the future? Companies are taking notice.
Grafana vs Kibana: The Updated Guide For 2022
If you have any experience with comparing open source data visualisation tools then it is very likely you will have encountered both Kibana and Grafana during your research and discovery phase. As two of the most popular solutions for logs and metrics analysis, it can be difficult to distinguish between the two and make the choice to use either Grafana or Kibana depending on the analysis task at hand.
Creating Dashboards from Multiple Data Sources - a Marketing Superpower
Why data visualization alone is not data storytelling
Why dashboards don't deliver on promised business value
Modern data and analytics leaders know that every business user is different. No two marketers or finance managers will use data in exactly the same way because no two share the same contextual view or understanding of the business. Their challenges are as nuanced as they are complex. And they need insights tailored to their specific needs if they are to be successful at solving business problems with data. Unfortunately, traditional BI tools treat everyone like carbon copies.
The Top 21 Grafana Dashboards & Visualisations
In our guide on the best Grafana dashboards examples, we wanted to show you some of the best ways you can use Grafana for a variety of different use cases across your organisation. Whether you are a software architect or a lead DevOps engineer, Grafana is used to make analysis and data visualisation far easier to conduct for busy engineering and technical teams throughout the world.
The Top 21 Kibana Dashboards & Visualisations
In this guide to the best Kibana dashboards examples around, we wanted to show you some of the most ingenious ways to use Kibana within your organisation to explore a wide range of ways that data and metrics can be centralised from every corner of your organisation.
Four ways static dashboards are costing your business
Ask any analyst how they spend the majority of their work day and they’ll tell you: Performing remedial tasks that provide no analytics value. 92% of data workers report that their time is being siphoned away performing operational tasks outside of their roles. Data teams waste an inordinate amount of time maintaining the delicate data-to-dashboards pipelines they’ve created, leaving only 50% of their time to actually analyze data.


